You can quickly incorporate another view of your grid data by using one of the following toggles in the sidebar:
• Depth
• Statistical Plots, in the Analyze menu, give additional methods to view data.
These data views have options to select either a cell or well. The current selection mode is shown in the sidebar. The crosshair containing the box is for cell probing. The crosshair with the well is for the well probing mode.
Stamp plot Y-axis range may be defined in one of two ways:
• “Range for each varaible in all entities of the same type”. This setting is the default and uses the Y-Axis range across all entities of the same type. This setting gives a common Y-Axis scale for each stamp and allows comparison of all stamps using the same range.
• “Range of variable values plotted in a single frame”. This setting is typically used when a stamp plot contains negative values. The Y-Axis range will encompass the range of variable values in a single stamp. This option gives the best “zoomed in” view of data in a single stamp, but is not recommended for comparing stamps since each stamp will be displayed using a different scale.
When you toggle-on “Time/history” in the sidebar, Tecplot RS reduces the size of the first frame to make room for another frame. The pointer also changes to a small crosshair with a box denoting the pointer is in cell probe mode.
Use the pointer to choose any cell in the grid. A line plot will fill the new frame. This graph represents the displayed grid variable for the chosen cell over all time steps.
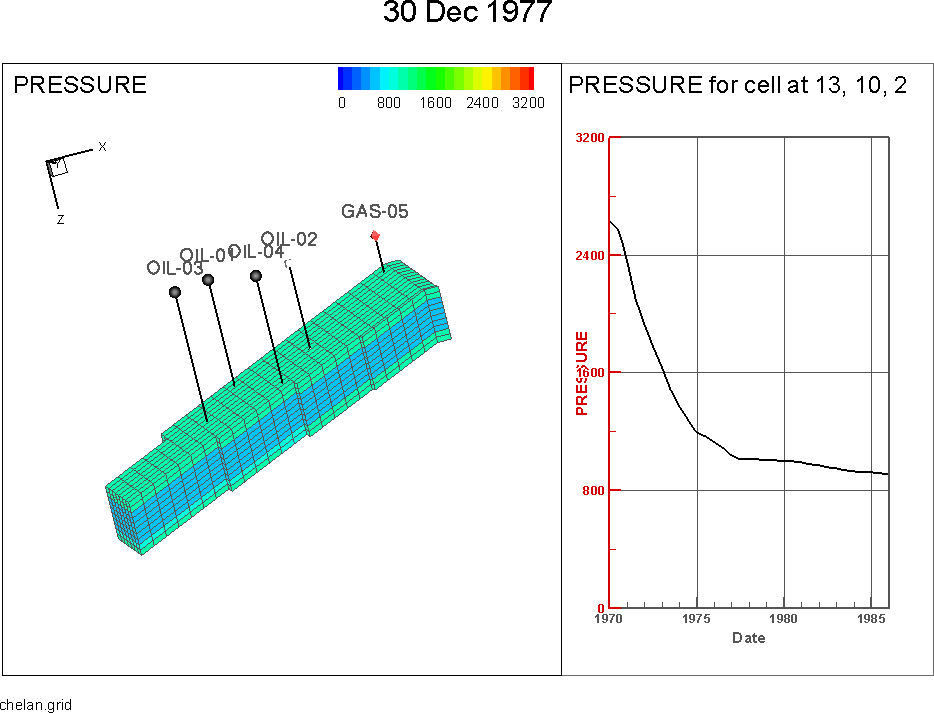
If you change the variable or highlight a different cell, Tecplot RS will update the Time/history frame to reflect the new selections. You can conveniently query values for a selected cell.
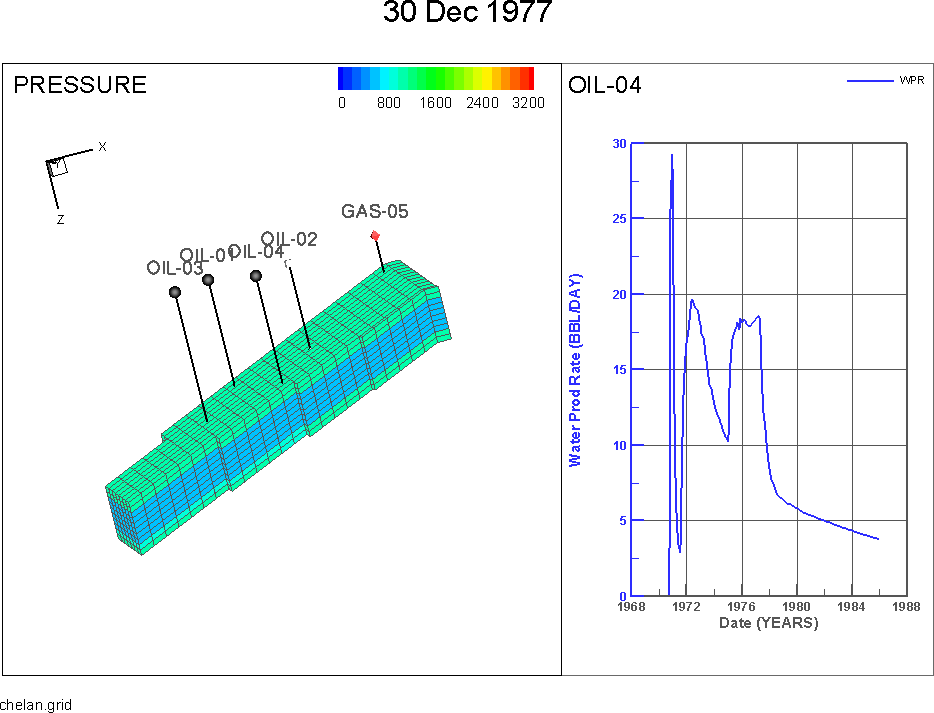
If XY data is loaded into a project with the grid solution, then a user can utilize the Time/history plot to XY data in the quick frame. A user can interactively choose the well data they want to view with the well probe. Clicking the cell that contains the well you are interested in is the most reliable way to choose a specific well.
The Depth toggle is similar in operation to the Time/History toggle, but the Depth plots show data at various depths. If you have loaded RFT data, you can Control-click a well to see the RFT plot for that well at the time closest to the one selected for the grid display. The sidebar settings for the RFT plot type (accessible by choosing RFT from the Plot Type menu) determine the variables that appear on the Depth plot. If the RFT data has values for multiple times, the Depth plot automatically updates as you change the grid time step.
If you are displaying grid data in 3D, you can also display another type of Depth plot. By clicking a cell (without the Control key) you can get a plot of the cell values versus depth for a column of cells at the IJ location where you clicked. The solution value in this plot is the one shown in the grid in the first frame. If you have chosen delta values, derived (equation values), or KSum/KAvg, the plot also reflects those. Animating or changing the time slider updates the plot at each time step.
|
|
