
Axes
Field Axes
Cartesian2DFieldAxes
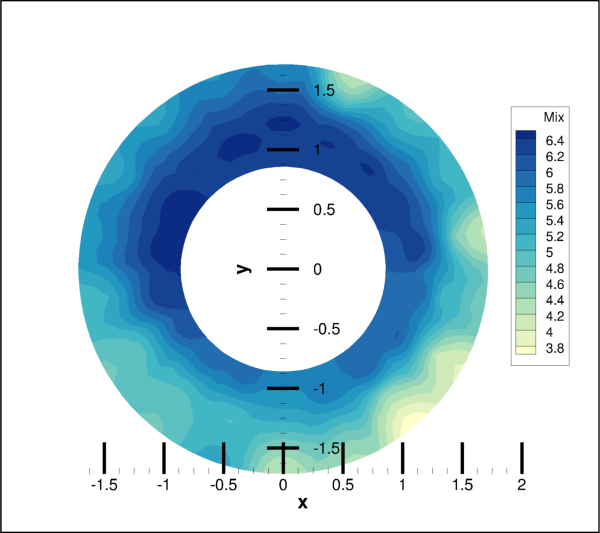
- class tecplot.plot.Cartesian2DFieldAxes(plot)[source]
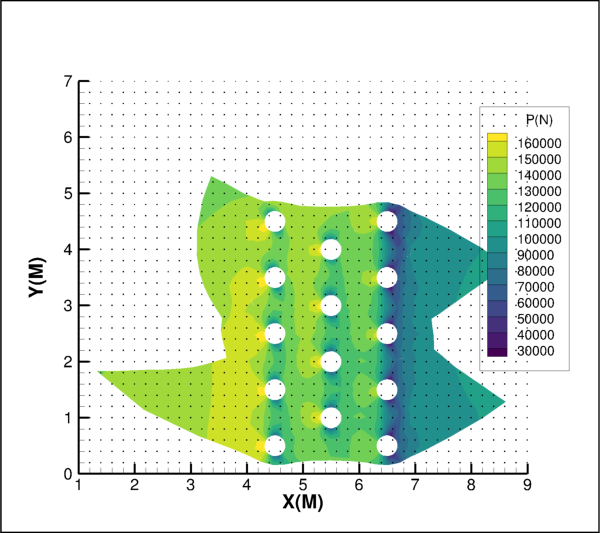
(X, Y) axes style control for 2D field plots.
from os import path
import tecplot as tp
from tecplot.constant import PlotType

examples_dir = tp.session.tecplot_examples_directory()
infile = path.join(examples_dir, 'SimpleData', 'HeatExchanger.plt')
dataset = tp.data.load_tecplot(infile)

frame = tp.active_frame()
plot = frame.plot(PlotType.Cartesian2D)

plot.show_shade = False
plot.show_contour = True

plot.axes.auto_adjust_ranges = True
plot.axes.precise_grid.show = True
plot.axes.precise_grid.size = 0.05

plot.view.fit()

# ensure consistent output between interactive (connected) and batch
plot.contour(0).levels.reset_to_nice()

tp.export.save_png('axes_2d.png', 600, supersample=3)
Attributes
Automatically adjust axis ranges to nice values.
Controls automatic adjustment of axis ranges.
Area bounded by the axes.
Precise dot grid.
Preserve scale (spacing between ticks) on range change.
Area of the frame used by the plot axes.
X-axis style control.
X:Y axis scaling ratio in percent.
Y-axis style control.
- Cartesian2DFieldAxes.auto_adjust_ranges
Automatically adjust axis ranges to nice values.
Axes limits will be adjusted to have the smallest number of significant digits possible:
>>> plot.axes.auto_adjust_ranges = False
- Type:
- Cartesian2DFieldAxes.axis_mode
Controls automatic adjustment of axis ranges.
Possible values:
Independent,XYDependent.If set to
XYDependent, then setting the range of one axis automatically scales the other indicated axes proportionally to maintain the aspect ratio of the plot, effectively zooming in or out. If set toIndependent, adjusting the range of one axis has no effect on other axes. Defaults toIndependentfor XY line plots,XYDependentfor 2D Cartesian plots. Example usage:>>> from tecplot.constant import AxisMode >>> plot.axes.axis_mode = AxisMode.Independent
- Type:
- Cartesian2DFieldAxes.grid_area
Area bounded by the axes.
This controls the background color and border of the axes:
>>> from tecplot.constant import Color >>> plot.axes.grid_area.fill_color = Color.LightGreen
- Type:
- Cartesian2DFieldAxes.precise_grid
Precise dot grid.
This is a set of small dots drawn at the intersection of every minor gridline. In line plots, the axis assignments for the first active mapping govern the precise dot grid. The precise dot grid option is disabled for the 3D Cartesian plots and Line plots when either axis for the first active line mapping uses a log scale:
>>> plot.axes.precise_grid.show = True
- Type:
- Cartesian2DFieldAxes.preserve_scale
Preserve scale (spacing between ticks) on range change.
This maintains the axis scaling, i.e. the distance between values along the axis. If
False, the axes length will be preserved when the range changes:>>> plot.axes.preserve_scale = False >>> # get axis via "plot.axes.x_axis(0)" for line plots >>> # or "plot.axes.x_axis" for field or sketch plots >>> axis.max = 10 # axis scale is changed (length is preserved)
- Type:
- Cartesian2DFieldAxes.viewport
Area of the frame used by the plot axes.
Example usage:
>>> plot.axes.viewport.left = 5 >>> plot.axes.viewport.right = 95 >>> plot.axes.viewport.top = 95 >>> plot.axes.viewport.bottom = 5
- Type:
- Cartesian2DFieldAxes.x_axis
X-axis style control.
Example usage:
>>> plot.axes.x_axis.show = False
- Type:
- Cartesian2DFieldAxes.xy_ratio
X:Y axis scaling ratio in percent.
This requires the axes to be in dependent mode:
>>> from tecplot.constant import AxisMode >>> plot.axes.axis_mode = AxisMode.XYDependent >>> plot.axes.xy_ratio = 2
- Type:
- Cartesian2DFieldAxes.y_axis
Y-axis style control.
Example usage:
>>> plot.axes.y_axis.show = False
- Type:
Cartesian2DFieldAxis
- class tecplot.plot.Cartesian2DFieldAxis(axes, name, **kwargs)[source]
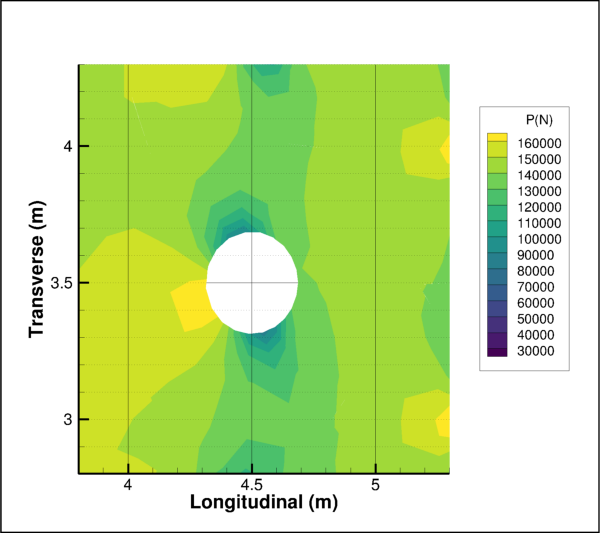
X or Y axis for 2D field plots.
from os import path import tecplot as tp from tecplot.constant import PlotType, AxisMode, AxisTitleMode examples_dir = tp.session.tecplot_examples_directory() infile = path.join(examples_dir, 'SimpleData', 'HeatExchanger.plt') dataset = tp.data.load_tecplot(infile) frame = tp.active_frame() plot = frame.plot(PlotType.Cartesian2D) plot.show_contour = True plot.axes.axis_mode = AxisMode.Independent plot.axes.viewport.right = 75 plot.axes.preserve_scale = False xaxis = plot.axes.x_axis xaxis.title.text = 'Longitudinal (m)' xaxis.title.title_mode = AxisTitleMode.UseText xaxis.min = 3.8 xaxis.max = 5.3 xaxis.grid_lines.show = True xaxis.grid_lines.draw_last = True yaxis = plot.axes.y_axis yaxis.title.text = 'Transverse (m)' yaxis.title.title_mode = AxisTitleMode.UseText yaxis.min = 2.8 yaxis.max = 4.3 yaxis.grid_lines.show = True yaxis.minor_grid_lines.show = True yaxis.minor_grid_lines.draw_last = True # ensure consistent output between interactive (connected) and batch plot.contour(0).levels.reset_to_nice() tp.export.save_png('axis_2d.png',600, supersample=3)
Attributes
Major grid lines style control.
Axis line style control.
Use logarithmic scale for this axis.
Marker line to indicate a particular position along an axis.
Upper bound of this axis' range.
Lower bound of this axis' range.
Minor grid lines style control.
Reverse the direction of the axis scale.
Enable drawing of this axis.
Axis ticks labels style control.
Axis major and minor ticks style control.
Axis title.
The
Variableassigned to this axis.Index of the
Variableassigned to this axis.Methods
Rounds the axis range to the nearest major axis increment.
fit_range([consider_blanking])Set range of axis to variable minimum and maximum.
fit_range_to_nice([consider_blanking])Set range of axis to nice values near variable minimum and maximum.
- Cartesian2DFieldAxis.adjust_range_to_nice()
Rounds the axis range to the nearest major axis increment.
This method resets the axis-line label values such that all currently displayed label values are set to have the smallest number of significant digits possible.
Example usage:
>>> # get axis via "plot.axes.x_axis(0)" for line plots >>> # or "plot.axes.x_axis" for field or sketch plots >>> axis.adjust_range_to_nice()
- Cartesian2DFieldAxis.fit_range(consider_blanking=True)
Set range of axis to variable minimum and maximum.
Note
If the axis dependency is not
Independent, then this action may also affect the range on another axis.- Parameters:
consider_blanking (
Boolean, optional) – IfTrueand blanking is enabled, the resulting view excludes blanked cells at the edges of the plot. IfFalse, then the resulting view will ignore blanked cells at the edges of the plot. (default:True)
Example usage:
>>> # get axis via "plot.axes.x_axis(0)" for line plots >>> # or "plot.axes.x_axis" for field or sketch plots >>> axis.fit_range()
- Cartesian2DFieldAxis.fit_range_to_nice(consider_blanking=True)
Set range of axis to nice values near variable minimum and maximum.
This method resets the range to equal the minimum and maximum of the data being plotted, but makes the axis values “nice” by setting labels to have the smallest number of significant digits possible,
Note
If the axis dependency is not independent then this method may also affect the range on another axis.
- Parameters:
consider_blanking (
Boolean, optional) – IfTrueand blanking is enabled, the resulting view excludes blanked cells at the edges of the plot. IfFalse, then the resulting view will ignore blanked cells at the edges of the plot. (default:True)
Example usage:
>>> # get axis via "plot.axes.x_axis(0)" for line plots >>> # or "plot.axes.x_axis" for field or sketch plots >>> axis.fit_range_to_nice()
- Cartesian2DFieldAxis.grid_lines
Major grid lines style control.
Major grid lines are attached to the locations of the major ticks. See
minor_grid_linesfor lines attached to minor ticks. Example usage:>>> # get axis via "plot.axes.x_axis(0)" for line plots >>> # or "plot.axes.x_axis" for field or sketch plots >>> axis.grid_lines.show = True
- Type:
- Cartesian2DFieldAxis.line
Axis line style control.
Example usage:
>>> # get axis via "plot.axes.x_axis(0)" for line plots >>> # or "plot.axes.x_axis" for field or sketch plots >>> axis.line.line_thickness = 0.6
- Type:
- Cartesian2DFieldAxis.log_scale
Use logarithmic scale for this axis.
Example usage:
>>> # get axis via "plot.axes.x_axis(0)" for line plots >>> # or "plot.axes.x_axis" for field or sketch plots >>> # or "plot.axes.r_axis" for the radial axis in polar plots >>> axis.log_scale = True
- Type:
- Cartesian2DFieldAxis.marker_grid_line
Marker line to indicate a particular position along an axis.
Example usage:
>>> # get axis via "plot.axes.x_axis(0)" for line plots >>> # or "plot.axes.x_axis" for field or sketch plots >>> axis.marker_grid_line.show = True >>> axis.marker_grid_line.position = 0.5
- Type:
- Cartesian2DFieldAxis.max
Upper bound of this axis’ range.
Example usage:
>>> # get axis via "plot.axes.x_axis(0)" for line plots >>> # or "plot.axes.x_axis" for field or sketch plots >>> axis.max = 1.0
- Type:
- Cartesian2DFieldAxis.min
Lower bound of this axis’ range.
Example usage:
>>> # get axis via "plot.axes.x_axis(0)" for line plots >>> # or "plot.axes.x_axis" for field or sketch plots >>> axis.min = 0.0
- Type:
- Cartesian2DFieldAxis.minor_grid_lines
Minor grid lines style control.
Minor grid lines are attached to the locations of the minor ticks. Example usage:
>>> # get axis via "plot.axes.x_axis(0)" for line plots >>> # or "plot.axes.x_axis" for field or sketch plots >>> axis.minor_grid_lines.show = True
- Type:
- Cartesian2DFieldAxis.reverse
Reverse the direction of the axis scale.
Example usage:
>>> # get axis via "plot.axes.x_axis(0)" for line plots >>> # or "plot.axes.x_axis" for field or sketch plots >>> axis.reverse = True
- Type:
- Cartesian2DFieldAxis.show
Enable drawing of this axis.
Example usage:
>>> # get axis via "plot.axes.x_axis(0)" for line plots >>> # or "plot.axes.x_axis" for field or sketch plots >>> axis.show = True
- Type:
- Cartesian2DFieldAxis.tick_labels
Axis ticks labels style control.
Example usage:
>>> # get axis via "plot.axes.x_axis(0)" for line plots >>> # or "plot.axes.x_axis" for field or sketch plots >>> axis.tick_labels.show = False
- Type:
- Cartesian2DFieldAxis.ticks
Axis major and minor ticks style control.
Example usage:
>>> # get axis via "plot.axes.x_axis(0)" for line plots >>> # or "plot.axes.x_axis" for field or sketch plots >>> axis.ticks.line_thickness = 0.8
- Type:
- Cartesian2DFieldAxis.title
Axis title.
This is the primary label for the axis and usually includes units:
>>> # get axis via "plot.axes.x_axis(0)" for line plots >>> # or "plot.axes.x_axis" for field or sketch plots >>> axis.title.text = 'distance (m)'
- Type:
- Cartesian2DFieldAxis.variable
The
Variableassigned to this axis.This is the spatial variable associated with this axis and is usually one of
(X, Y, Z). Example usage:import tecplot as tp from tecplot.constant import PlotType fr = tp.active_frame() ds = fr.create_dataset('D', ['X', 'Y', 'Z', 'U', 'V']) axes = fr.plot(PlotType.Cartesian3D).axes # prints: ('X', 'Y') print(axes.x_axis.variable.name, axes.y_axis.variable.name) axes.x_axis.variable = ds.variable('U') axes.y_axis.variable = ds.variable('V') # prints: ('U', 'V) print(axes.x_axis.variable.name, axes.y_axis.variable.name)
- Type:
- Cartesian2DFieldAxis.variable_index
Index of the
Variableassigned to this axis.Example usage, interchanging the (x, y) axes:
>>> v0 = plot.axes.x_axis.variable_index >>> v1 = plot.axes.y_axis.variable_index >>> plot.axes.x_axis.variable_index = v1 >>> plot.axes.y_axis.variable_index = v0
- Type:
Index(zero-based)
Cartesian3DFieldAxes
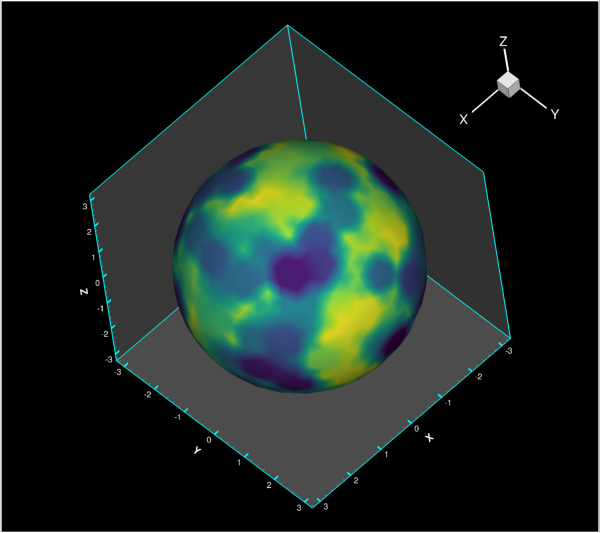
- class tecplot.plot.Cartesian3DFieldAxes(plot)[source]
(X, Y, Z) axes style control for 3D field plots.
from os import path import tecplot as tp from tecplot.constant import PlotType, Color examples_dir = tp.session.tecplot_examples_directory() infile = path.join(examples_dir, 'SimpleData', 'Sphere.lpk') dataset = tp.load_layout(infile) frame = tp.active_frame() plot = frame.plot() plot.axes.x_axis.show = True plot.axes.y_axis.show = True plot.axes.z_axis.show = True plot.axes.grid_area.fill_color = Color.SkyBlue plot.axes.padding = 20 plot.view.fit() tp.export.save_png('axes_3d.png', 600, supersample=3)

Attributes
Scale limit of the axes aspect ratio.
Axes scale aspect ratio used when
aspect_ratio_limitis exceeded.Enable automatically choosing which edges to label.
Scale dependencies along each axis.
Area of the viewport used by the axes.
Get the 3D Orientation Axes.
Margin of axis padding around data in percent of data extent.
Preserve scale (spacing between ticks) on range change.
Range limit of the axes aspect ratio.
Axes range aspect ratio used
range_aspect_ratio_limitis exceeded.Area of the frame used by the plot axes.
X-axis style control.
X:Y axis scaling ratio in percent.
X:Z axis scaling ratio in percent.
Y-axis style control.
Z-axis style control.
Methods
reset_origin([location])Set the origin to the specified location.
Recalculate and set the ranges for each axis.
Recalculate and set the scale factors for each axis.
- Cartesian3DFieldAxes.aspect_ratio_limit
Scale limit of the axes aspect ratio.
This is the limit above which the axes relative scales will be pegged to
aspect_ratio_reset. The following example will set the aspect ratio between scales to 1 if they first exceed a ratio of 10:>>> plot.axes.aspect_ratio_limit = 10 >>> plot.axes.aspect_ratio_reset = 1 >>> plot.axes.reset_scale()
- Type:
- Cartesian3DFieldAxes.aspect_ratio_reset
Axes scale aspect ratio used when
aspect_ratio_limitis exceeded.This is the aspect ratio used to scale the axes when the data’s aspect ratio exceeds the value set to
aspect_ratio_limit. The following example will set the aspect ratio between scales to 10 if they first exceed a ratio of 15:>>> plot.axes.aspect_ratio_limit = 15 >>> plot.axes.aspect_ratio_reset = 10 >>> plot.axes.reset_scale()
- Type:
- Cartesian3DFieldAxes.auto_edge_assignment
Enable automatically choosing which edges to label.
Example usage:
>>> plot.axes.auto_edge_assignment = True
- Type:
- Cartesian3DFieldAxes.axis_mode
Scale dependencies along each axis.
Possible values:
Independent,XYDependent,XYZDependent.If set to
XYDependentorXYZDependent, then setting the range of one axis automatically scales the other indicated axes proportionally to maintain the aspect ratio of the plot, effectively zooming in or out. If set toIndependent, adjusting the range of one axis has no effect on other axes. Defaults toXYZDependentfor 3D Cartesian plots. Both dependent modes allow specifying the axes scaling ratios:>>> from tecplot.constant import AxisMode >>> plot.axes.axis_mode = AxisMode.XYZDependent >>> plot.axes.xy_ratio = 2 >>> plot.axes.xz_ratio = 20
- Type:
- Cartesian3DFieldAxes.grid_area
Area of the viewport used by the axes.
Example usage:
>>> plot.axes.grid_area.fill_color = Color.LightGreen
- Type:
- Cartesian3DFieldAxes.orientation_axis
Get the 3D Orientation Axes.
Example usage:
>>> # Hide the orientation axes >>> plot.axes.orientation_axis.show = False
- Type:
- Cartesian3DFieldAxes.padding
Margin of axis padding around data in percent of data extent.
Example usage:
>>> plot.axes.padding = 5
- Type:
- Cartesian3DFieldAxes.preserve_scale
Preserve scale (spacing between ticks) on range change.
This maintains the axis scaling, i.e. the distance between values along the axis. If
False, the axes length will be preserved when the range changes:>>> plot.axes.preserve_scale = False >>> # get axis via "plot.axes.x_axis(0)" for line plots >>> # or "plot.axes.x_axis" for field or sketch plots >>> axis.max = 10 # axis scale is changed (length is preserved)
- Type:
- Cartesian3DFieldAxes.range_aspect_ratio_limit
Range limit of the axes aspect ratio.
This is the limit above which the axes’ relative ranges will be pegged to
range_aspect_ratio_reset. The following example will set the aspect ratio between ranges to 1 if they first exceed a ratio of 10:>>> plot.axes.range_aspect_ratio_limit = 10 >>> plot.axes.range_aspect_ratio_reset = 1 >>> plot.axes.reset_range()
- Type:
- Cartesian3DFieldAxes.range_aspect_ratio_reset
Axes range aspect ratio used
range_aspect_ratio_limitis exceeded.This is the aspect ratio used to set the ranges of the axes when the axes’ aspect ratios exceed the value of
range_aspect_ratio_limit. The following example will set the aspect ratio between ranges to 10 if they first exceed a ratio of 15:>>> plot.axes.range_aspect_ratio_limit = 15 >>> plot.axes.range_aspect_ratio_reset = 10 >>> plot.axes.reset_range()
- Type:
- Cartesian3DFieldAxes.reset_origin(location=OriginResetLocation.DataCenter)
Set the origin to the specified location.
- Parameters:
location (
OriginResetLocation, optional) – Either the center of the data withOriginResetLocation.DataCenter(default) or the center of the viewport withOriginResetLocation.ViewCenter.
Example usage:
>>> from tecplot.constant import OriginResetLocation >>> plot.axes.reset_origin(OriginResetLocation.ViewCenter)
- Cartesian3DFieldAxes.reset_range()
Recalculate and set the ranges for each axis.
Example usage:
>>> plot.axes.reset_range()
- Cartesian3DFieldAxes.reset_scale()
Recalculate and set the scale factors for each axis.
Aspect ratio limits are taken into account:
>>> plot.axes.reset_scale()
- Cartesian3DFieldAxes.viewport
Area of the frame used by the plot axes.
Example usage:
>>> print(plot.axes.viewport.bottom) 5
- Type:
- Cartesian3DFieldAxes.x_axis
X-axis style control.
Example usage:
>>> plot.axes.x_axis.show = True
- Type:
- Cartesian3DFieldAxes.xy_ratio
X:Y axis scaling ratio in percent.
This requires the axes to be in dependent mode:
>>> from tecplot.constant import AxisMode >>> plot.axes.axis_mode = AxisMode.XYDependent >>> plot.axes.xy_ratio = 2
- Type:
- Cartesian3DFieldAxes.xz_ratio
X:Z axis scaling ratio in percent.
This requires the axes to be in dependent mode:
>>> from tecplot.constant import AxisMode >>> plot.axes.axis_mode = AxisMode.XYZDependent >>> plot.axes.xy_ratio = 2 >>> plot.axes.xz_ratio = 20
- Type:
- Cartesian3DFieldAxes.y_axis
Y-axis style control.
Example usage:
>>> plot.axes.y_axis.show = True
- Type:
- Cartesian3DFieldAxes.z_axis
Z-axis style control.
Example usage:
>>> plot.axes.z_axis.show = True
- Type:
Cartesian3DFieldAxis
- class tecplot.plot.Cartesian3DFieldAxis(axes, name, **kwargs)[source]
X, Y or Z axis on 3D field plots.
from os import path import tecplot as tp from tecplot.constant import PlotType, Color, AxisLine3DAssignment examples_dir = tp.session.tecplot_examples_directory() infile = path.join(examples_dir, 'SimpleData', 'RainierElevation.lay') tp.load_layout(infile) frame = tp.active_frame() dataset = frame.dataset plot = frame.plot(PlotType.Cartesian3D) plot.activate() plot.show_contour = True plot.axes.grid_area.filled = False axes = [plot.axes.x_axis, plot.axes.y_axis, plot.axes.z_axis] assignments = [AxisLine3DAssignment.YMinZMax, AxisLine3DAssignment.ZMaxXMin, AxisLine3DAssignment.XMaxYMin] for ax, asgn in zip(axes, assignments): ax.show = True ax.grid_lines.show = False ax.title.show = False ax.line.show = False ax.line.edge_assignment = asgn plot.axes.z_axis.grid_lines.show = True plot.axes.y_axis.min=-2000 plot.axes.y_axis.max=1000 plot.axes.x_axis.min=-9500 plot.axes.x_axis.max=-7200 plot.axes.z_axis.min=0 plot.axes.x_axis.scale_factor=1.9 plot.view.width = 7830 plot.view.alpha = 0 plot.view.theta = -147.5 plot.view.psi = 70 plot.view.position = (1975, 15620, 115930) tp.export.save_png('axis_3d.png', 600, supersample=3)

Attributes
Major grid lines style control.
Axis line style control.
Marker line to indicate a particular position along an axis.
Upper bound of this axis' range.
Lower bound of this axis' range.
Minor grid lines style control.
Factor used for axis scaling.
Enable drawing of this axis.
Axis ticks labels style control.
Axis major and minor ticks style control.
Axis title.
The
Variableassigned to this axis.Index of the
Variableassigned to this axis.Methods
Rounds the axis range to the nearest major axis increment.
fit_range([consider_blanking])Set range of axis to variable minimum and maximum.
fit_range_to_nice([consider_blanking])Set range of axis to nice values near variable minimum and maximum.
- Cartesian3DFieldAxis.adjust_range_to_nice()
Rounds the axis range to the nearest major axis increment.
This method resets the axis-line label values such that all currently displayed label values are set to have the smallest number of significant digits possible.
Example usage:
>>> # get axis via "plot.axes.x_axis(0)" for line plots >>> # or "plot.axes.x_axis" for field or sketch plots >>> axis.adjust_range_to_nice()
- Cartesian3DFieldAxis.fit_range(consider_blanking=True)
Set range of axis to variable minimum and maximum.
Note
If the axis dependency is not
Independent, then this action may also affect the range on another axis.- Parameters:
consider_blanking (
Boolean, optional) – IfTrueand blanking is enabled, the resulting view excludes blanked cells at the edges of the plot. IfFalse, then the resulting view will ignore blanked cells at the edges of the plot. (default:True)
Example usage:
>>> # get axis via "plot.axes.x_axis(0)" for line plots >>> # or "plot.axes.x_axis" for field or sketch plots >>> axis.fit_range()
- Cartesian3DFieldAxis.fit_range_to_nice(consider_blanking=True)
Set range of axis to nice values near variable minimum and maximum.
This method resets the range to equal the minimum and maximum of the data being plotted, but makes the axis values “nice” by setting labels to have the smallest number of significant digits possible,
Note
If the axis dependency is not independent then this method may also affect the range on another axis.
- Parameters:
consider_blanking (
Boolean, optional) – IfTrueand blanking is enabled, the resulting view excludes blanked cells at the edges of the plot. IfFalse, then the resulting view will ignore blanked cells at the edges of the plot. (default:True)
Example usage:
>>> # get axis via "plot.axes.x_axis(0)" for line plots >>> # or "plot.axes.x_axis" for field or sketch plots >>> axis.fit_range_to_nice()
- Cartesian3DFieldAxis.grid_lines
Major grid lines style control.
Major grid lines are attached to the locations of the major ticks. See
minor_grid_linesfor lines attached to minor ticks. Example usage:>>> plot.axes.x_axis.grid_lines.show = True
- Type:
- Cartesian3DFieldAxis.line
Axis line style control.
Example usage:
>>> plot.axes.x_axis.line.line_thickness = 0.6
- Type:
- Cartesian3DFieldAxis.marker_grid_line
Marker line to indicate a particular position along an axis.
Example usage:
>>> plot.axes.x_axis.marker_grid_line.show = True >>> plot.axes.x_axis.marker_grid_line.position = 0.5
- Type:
- Cartesian3DFieldAxis.max
Upper bound of this axis’ range.
Example usage:
>>> # get axis via "plot.axes.x_axis(0)" for line plots >>> # or "plot.axes.x_axis" for field or sketch plots >>> axis.max = 1.0
- Type:
- Cartesian3DFieldAxis.min
Lower bound of this axis’ range.
Example usage:
>>> # get axis via "plot.axes.x_axis(0)" for line plots >>> # or "plot.axes.x_axis" for field or sketch plots >>> axis.min = 0.0
- Type:
- Cartesian3DFieldAxis.minor_grid_lines
Minor grid lines style control.
Minor grid lines are attached to the locations of the minor ticks. Example usage:
>>> plot.axes.x_axis.minor_grid_lines.show = True
- Type:
- Cartesian3DFieldAxis.scale_factor
Factor used for axis scaling.
This will automatically scale the other axes if axis mode dependent. Setting the axis mode to independent allows each axis to have their own scale factor:
>>> from tecplot.constant import AxisMode >>> plot.axes.axis_mode = AxisMode.Independent >>> plot.axes.x_axis.scale_factor = 1 >>> plot.axes.y_axis.scale_factor = 2 >>> plot.axes.z_axis.scale_factor = 3
- Type:
- Cartesian3DFieldAxis.show
Enable drawing of this axis.
Example usage:
>>> # get axis via "plot.axes.x_axis(0)" for line plots >>> # or "plot.axes.x_axis" for field or sketch plots >>> axis.show = True
- Type:
- Cartesian3DFieldAxis.tick_labels
Axis ticks labels style control.
Example usage:
>>> plot.axes.x_axis.tick_labels.show = False
- Type:
- Cartesian3DFieldAxis.ticks
Axis major and minor ticks style control.
Example usage:
>>> plot.axes.x_axis.ticks.line_thickness = 0.8
- Type:
- Cartesian3DFieldAxis.title
Axis title.
This is the primary label for the axis and usually includes units:
>>> plot.axes.x_axis.title.text = 'distance (m)'
- Type:
- Cartesian3DFieldAxis.variable
The
Variableassigned to this axis.This is the spatial variable associated with this axis and is usually one of
(X, Y, Z). Example usage:import tecplot as tp from tecplot.constant import PlotType fr = tp.active_frame() ds = fr.create_dataset('D', ['X', 'Y', 'Z', 'U', 'V']) axes = fr.plot(PlotType.Cartesian3D).axes # prints: ('X', 'Y') print(axes.x_axis.variable.name, axes.y_axis.variable.name) axes.x_axis.variable = ds.variable('U') axes.y_axis.variable = ds.variable('V') # prints: ('U', 'V) print(axes.x_axis.variable.name, axes.y_axis.variable.name)
- Type:
- Cartesian3DFieldAxis.variable_index
Index of the
Variableassigned to this axis.Example usage, interchanging the (x, y) axes:
>>> v0 = plot.axes.x_axis.variable_index >>> v1 = plot.axes.y_axis.variable_index >>> plot.axes.x_axis.variable_index = v1 >>> plot.axes.y_axis.variable_index = v0
- Type:
Index(zero-based)
Line Axes
XYLineAxes
- class tecplot.plot.XYLineAxes(plot)[source]
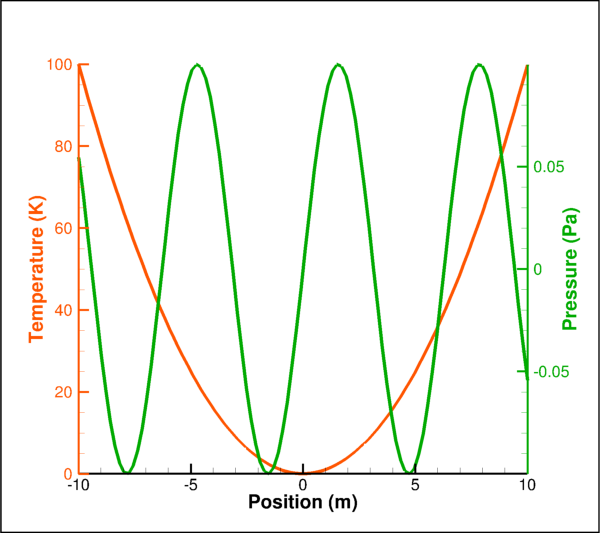
(X, Y) axes style control for line plots.
The
axesproperty of aXYLinePlotallows access to the severalxandyaxes by index. Linemaps can use any of the five such axes. In this example, we create two sets of data with different scales and the second y-axis is used on the right side of the plot:import numpy as np import tecplot as tp from tecplot.constant import PlotType, Color frame = tp.active_frame() npoints = 100 x = np.linspace(-10,10,npoints) t = x**2 p = 0.1 * np.sin(x) dataset = frame.create_dataset('data', ['Position (m)', 'Temperature (K)', 'Pressure (Pa)']) zone = dataset.add_ordered_zone('zone', (100,)) zone.values('Position (m)')[:] = x zone.values('Temperature (K)')[:] = t zone.values('Pressure (Pa)')[:] = p plot = frame.plot(PlotType.XYLine) plot.activate() plot.delete_linemaps() temp = plot.add_linemap('temp', zone, dataset.variable('Position (m)'), dataset.variable('Temperature (K)')) press = plot.add_linemap('press', zone, dataset.variable('Position (m)'), dataset.variable('Pressure (Pa)')) # Color the line and the y-axis for temperature temp.line.color = Color.RedOrange temp.line.line_thickness = 0.8 ax = plot.axes.y_axis(0) ax.line.color = temp.line.color ax.tick_labels.color = temp.line.color ax.title.color = temp.line.color # set pressure linemap to second x-axis press.y_axis_index = 1 # Color the line and the y-axis for pressure press.line.color = Color.Chartreuse press.line.line_thickness = 0.8 ax = plot.axes.y_axis(1) ax.line.color = press.line.color ax.tick_labels.color = press.line.color ax.title.color = press.line.color tp.export.save_png('axes_line.png', 600, supersample=3)
Attributes
Automatically adjust axis ranges to nice values.
Controls automatic adjustment of axis ranges.
Area bounded by the axes.
Precise dot grid.
Preserve scale (spacing between ticks) on range change.
Area of the frame used by the plot axes.
X:Y axis scaling ratio in percent.
Methods
x_axis(index)XYLineAxis: X-axis style control.y_axis(index)XYLineAxis: Y-axis style control.
- XYLineAxes.auto_adjust_ranges
Automatically adjust axis ranges to nice values.
Axes limits will be adjusted to have the smallest number of significant digits possible:
>>> plot.axes.auto_adjust_ranges = False
- Type:
- XYLineAxes.axis_mode
Controls automatic adjustment of axis ranges.
Possible values:
Independent,XYDependent.If set to
XYDependent, then setting the range of one axis automatically scales the other indicated axes proportionally to maintain the aspect ratio of the plot, effectively zooming in or out. If set toIndependent, adjusting the range of one axis has no effect on other axes. Defaults toIndependentfor XY line plots,XYDependentfor 2D Cartesian plots. Example usage:>>> from tecplot.constant import AxisMode >>> plot.axes.axis_mode = AxisMode.Independent
- Type:
- XYLineAxes.grid_area
Area bounded by the axes.
This controls the background color and border of the axes:
>>> from tecplot.constant import Color
>>> plot.axes.grid_area.fill_color = Color.LightGreen
- Type:
- XYLineAxes.precise_grid
Precise dot grid.
This is a set of small dots drawn at the intersection of every minor gridline. In line plots, the axis assignments for the first active mapping govern the precise dot grid. The precise dot grid option is disabled for the 3D Cartesian plots and Line plots when either axis for the first active line mapping uses a log scale:
>>> plot.axes.precise_grid.show = True
- Type:
- XYLineAxes.preserve_scale
Preserve scale (spacing between ticks) on range change.
This maintains the axis scaling, i.e. the distance between values along the axis. If
False, the axes length will be preserved when the range changes:>>> plot.axes.preserve_scale = False >>> # get axis via "plot.axes.x_axis(0)" for line plots >>> # or "plot.axes.x_axis" for field or sketch plots >>> axis.max = 10 # axis scale is changed (length is preserved)
- Type:
- XYLineAxes.viewport
Area of the frame used by the plot axes.
Example usage:
>>> plot.axes.viewport.left = 5
>>> plot.axes.viewport.right = 95
>>> plot.axes.viewport.top = 95
>>> plot.axes.viewport.bottom = 5
- Type:
- XYLineAxes.x_axis(index)[source]
XYLineAxis: X-axis style control.There are five x-axes for each
XYLinePlot, indexed from 0 to 4 inclusive:>>> plot.axes.x_axis(0).show = True
- XYLineAxes.xy_ratio
X:Y axis scaling ratio in percent.
This requires the axes to be in dependent mode:
>>> from tecplot.constant import AxisMode
>>> plot.axes.axis_mode = AxisMode.XYDependent
>>> plot.axes.xy_ratio = 2
- Type:
- XYLineAxes.y_axis(index)[source]
XYLineAxis: Y-axis style control.There are five y-axes for each
XYLinePlot, indexed from 0 to 4 inclusive:>>> plot.axes.y_axis(0).show = True
XYLineAxis
- class tecplot.plot.XYLineAxis(axes, name, index)[source]
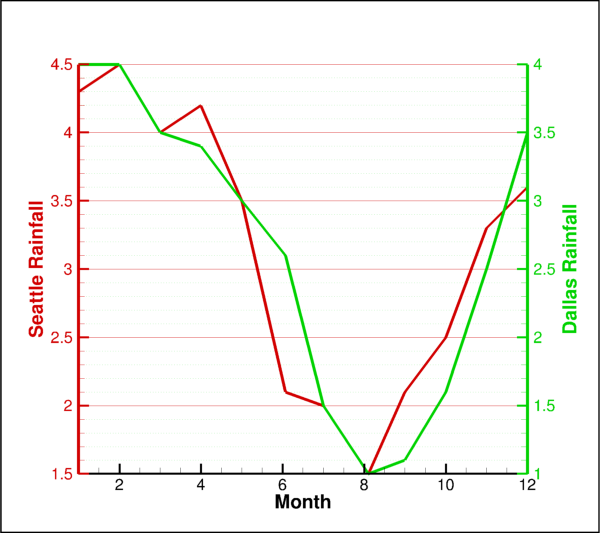
X or Y axis for line plots.
from os import path import tecplot as tp from tecplot.constant import PlotType examples_dir = tp.session.tecplot_examples_directory() infile = path.join(examples_dir, 'SimpleData', 'Rainfall.dat') dataset = tp.data.load_tecplot(infile) plot = tp.active_frame().plot(PlotType.XYLine) plot.activate() for i in range(2): lmap = plot.linemap(i) lmap.show = True lmap.line.line_thickness = 0.6 lmap.y_axis_index = i yax = plot.axes.y_axis(i) yax.line.color = lmap.line.color yax.title.color = lmap.line.color yax.tick_labels.color = lmap.line.color yax.line.line_thickness = 0.6 if i == 0: yax.grid_lines.show = True yax.grid_lines.color = lmap.line.color elif i == 1: yax.minor_grid_lines.show = True yax.minor_grid_lines.color = lmap.line.color tp.export.save_png('axis_line.png', 600, supersample=3)
Attributes
Major grid lines style control.
Axis line style control.
Use logarithmic scale for this axis.
Marker line to indicate a particular position along an axis.
Upper bound of this axis' range.
Lower bound of this axis' range.
Minor grid lines style control.
Reverse the direction of the axis scale.
Enable drawing of this axis.
Axis ticks labels style control.
Axis major and minor ticks style control.
Axis title.
Methods
Rounds the axis range to the nearest major axis increment.
Set range of axis to variable minimum and maximum.
Set range of axis to nice values near variable minimum and maximum.
- XYLineAxis.adjust_range_to_nice()
Rounds the axis range to the nearest major axis increment.
This method resets the axis-line label values such that all currently displayed label values are set to have the smallest number of significant digits possible.
Example usage:
>>> # get axis via "plot.axes.x_axis(0)" for line plots
>>> # or "plot.axes.x_axis" for field or sketch plots
>>> axis.adjust_range_to_nice()
- XYLineAxis.fit_range()
Set range of axis to variable minimum and maximum.
Note
If the axis dependency is not
Independent, then this action may also affect the range on another axis.Example usage:
>>> # get axis via "plot.axes.x_axis(0)" for line plots
>>> # or "plot.axes.x_axis" for field or sketch plots
>>> axis.fit_range()
- XYLineAxis.fit_range_to_nice()
Set range of axis to nice values near variable minimum and maximum.
This method resets the range to equal the minimum and maximum of the data being plotted, but makes the axis values “nice” by setting labels to have the smallest number of significant digits possible,
Note
If the axis dependency is not independent then this method may also affect the range on another axis.
Example usage:
>>> # get axis via "plot.axes.x_axis(0)" for line plots
>>> # or "plot.axes.x_axis" for field or sketch plots
>>> axis.fit_range_to_nice()
- XYLineAxis.grid_lines
Major grid lines style control.
Major grid lines are attached to the locations of the major ticks. See
minor_grid_linesfor lines attached to minor ticks. Example usage:>>> # get axis via "plot.axes.x_axis(0)" for line plots >>> # or "plot.axes.x_axis" for field or sketch plots >>> axis.grid_lines.show = True
- Type:
- XYLineAxis.line
Axis line style control.
Example usage:
>>> # get axis via "plot.axes.x_axis(0)" for line plots
>>> # or "plot.axes.x_axis" for field or sketch plots
>>> axis.line.line_thickness = 0.6
- Type:
- XYLineAxis.log_scale
Use logarithmic scale for this axis.
Example usage:
>>> # get axis via "plot.axes.x_axis(0)" for line plots
>>> # or "plot.axes.x_axis" for field or sketch plots
>>> # or "plot.axes.r_axis" for the radial axis in polar plots
>>> axis.log_scale = True
- Type:
- XYLineAxis.marker_grid_line
Marker line to indicate a particular position along an axis.
Example usage:
>>> # get axis via "plot.axes.x_axis(0)" for line plots
>>> # or "plot.axes.x_axis" for field or sketch plots
>>> axis.marker_grid_line.show = True
>>> axis.marker_grid_line.position = 0.5
- Type:
- XYLineAxis.max
Upper bound of this axis’ range.
Example usage:
>>> # get axis via "plot.axes.x_axis(0)" for line plots
>>> # or "plot.axes.x_axis" for field or sketch plots
>>> axis.max = 1.0
- Type:
- XYLineAxis.min
Lower bound of this axis’ range.
Example usage:
>>> # get axis via "plot.axes.x_axis(0)" for line plots
>>> # or "plot.axes.x_axis" for field or sketch plots
>>> axis.min = 0.0
- Type:
- XYLineAxis.minor_grid_lines
Minor grid lines style control.
Minor grid lines are attached to the locations of the minor ticks. Example usage:
>>> # get axis via "plot.axes.x_axis(0)" for line plots
>>> # or "plot.axes.x_axis" for field or sketch plots
>>> axis.minor_grid_lines.show = True
- Type:
- XYLineAxis.reverse
Reverse the direction of the axis scale.
Example usage:
>>> # get axis via "plot.axes.x_axis(0)" for line plots
>>> # or "plot.axes.x_axis" for field or sketch plots
>>> axis.reverse = True
- Type:
- XYLineAxis.show
Enable drawing of this axis.
Example usage:
>>> # get axis via "plot.axes.x_axis(0)" for line plots
>>> # or "plot.axes.x_axis" for field or sketch plots
>>> axis.show = True
- Type:
- XYLineAxis.tick_labels
Axis ticks labels style control.
Example usage:
>>> # get axis via "plot.axes.x_axis(0)" for line plots
>>> # or "plot.axes.x_axis" for field or sketch plots
>>> axis.tick_labels.show = False
- Type:
- XYLineAxis.ticks
Axis major and minor ticks style control.
Example usage:
>>> # get axis via "plot.axes.x_axis(0)" for line plots
>>> # or "plot.axes.x_axis" for field or sketch plots
>>> axis.ticks.line_thickness = 0.8
- Type:
PolarLineAxes
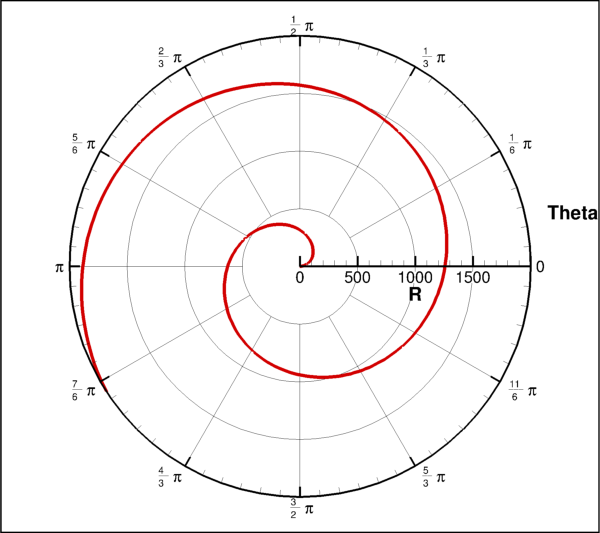
- class tecplot.plot.PolarLineAxes(plot)[source]
(R, Theta) axes style control for polar plots.
Example usage:
import numpy as np import tecplot as tp from tecplot.constant import PlotType, ThetaMode frame = tp.active_frame() npoints = 300 r = np.linspace(0, 2000, npoints) theta = np.linspace(0, 10, npoints) dataset = frame.create_dataset('Data', ['R', 'Theta']) zone = dataset.add_ordered_zone('Zone', (300,)) zone.values('R')[:] = r zone.values('Theta')[:] = theta plot = frame.plot(PlotType.PolarLine) plot.activate() plot.axes.r_axis.max = np.max(r) plot.axes.theta_axis.mode = ThetaMode.Radians plot.delete_linemaps() lmap = plot.add_linemap('Linemap', zone, dataset.variable('R'), dataset.variable('Theta')) lmap.line.line_thickness = 0.8 plot.view.fit() tp.export.save_png('axes_polar.png', 600, supersample=3)
Attributes
Area bounded by the axes.
Precise dot grid.
Preserve scale (spacing between ticks) on range change.
Radial axis style control.
Polar-angle axis style control.
Area of the frame used by the plot axes outside the grid area.
- PolarLineAxes.grid_area
Area bounded by the axes.
This controls the background color and border of the axes:
>>> from tecplot.constant import Color >>> plot.axes.grid_area.fill_color = Color.LightGreen
- Type:
- PolarLineAxes.precise_grid
Precise dot grid.
This is a set of small dots drawn at the intersection of every minor gridline. In line plots, the axis assignments for the first active mapping govern the precise dot grid. The precise dot grid option is disabled for the 3D Cartesian plots and Line plots when either axis for the first active line mapping uses a log scale:
>>> plot.axes.precise_grid.show = True
- Type:
- PolarLineAxes.preserve_scale
Preserve scale (spacing between ticks) on range change.
This maintains the axis scaling, i.e. the distance between values along the axis. If
False, the axes length will be preserved when the range changes:>>> plot.axes.preserve_scale = False >>> # get axis via "plot.axes.x_axis(0)" for line plots >>> # or "plot.axes.x_axis" for field or sketch plots >>> axis.max = 10 # axis scale is changed (length is preserved)
- Type:
- PolarLineAxes.r_axis
Radial axis style control.
Example usage:
>>> plot.axes.r_axis.title.text = 'R (meters)'
- Type:
- PolarLineAxes.theta_axis
Polar-angle axis style control.
Example usage:
>>> plot.axes.theta_axis.title.text = 'Theta (radians)'
- Type:
- PolarLineAxes.viewport
Area of the frame used by the plot axes outside the grid area.
Example usage:
>>> from tecplot.constant import Color >>> plot.axes.viewport.fill_color = Color.LightGreen
- Type:
RadialLineAxis
- class tecplot.plot.RadialLineAxis(axes)[source]
The R axis for polar plots
See the example shown for the
theta axis.Attributes
Do not show data outside the axes area.
Major grid lines style control.
Radial axis line style control.
Use logarithmic scale for this axis.
Marker line to indicate a particular position along an axis.
Upper bound of this axis' range.
Lower bound of this axis' range.
Minor grid lines style control.
Value at the origin of the axis.
Reverse the direction of the axis scale.
Enable drawing of this axis.
Axis ticks labels style control.
Axis major and minor ticks style control.
Axis title.
Methods
Rounds the axis range to the nearest major axis increment.
Set range of axis to variable minimum and maximum.
Set range of axis to nice values near variable minimum and maximum.
- RadialLineAxis.adjust_range_to_nice()
Rounds the axis range to the nearest major axis increment.
This method resets the axis-line label values such that all currently displayed label values are set to have the smallest number of significant digits possible.
Example usage:
>>> # get axis via "plot.axes.x_axis(0)" for line plots >>> # or "plot.axes.x_axis" for field or sketch plots >>> axis.adjust_range_to_nice()
- RadialLineAxis.clip_data
Do not show data outside the axes area.
Example usage:
>>> plot.axes.clip_data = True
- Type:
- RadialLineAxis.fit_range()
Set range of axis to variable minimum and maximum.
Note
If the axis dependency is not
Independent, then this action may also affect the range on another axis.Example usage:
>>> # get axis via "plot.axes.x_axis(0)" for line plots >>> # or "plot.axes.x_axis" for field or sketch plots >>> axis.fit_range()
- RadialLineAxis.fit_range_to_nice()
Set range of axis to nice values near variable minimum and maximum.
This method resets the range to equal the minimum and maximum of the data being plotted, but makes the axis values “nice” by setting labels to have the smallest number of significant digits possible,
Note
If the axis dependency is not independent then this method may also affect the range on another axis.
Example usage:
>>> # get axis via "plot.axes.x_axis(0)" for line plots >>> # or "plot.axes.x_axis" for field or sketch plots >>> axis.fit_range_to_nice()
- RadialLineAxis.grid_lines
Major grid lines style control.
Major grid lines are attached to the locations of the major ticks. See
minor_grid_linesfor lines attached to minor ticks. Example usage:>>> # get axis via "plot.axes.x_axis(0)" for line plots >>> # or "plot.axes.x_axis" for field or sketch plots >>> axis.grid_lines.show = True
- Type:
- RadialLineAxis.line
Radial axis line style control.
Example usage:
>>> plot.axes.r_axis.line.line_thickness = 0.6
- Type:
- RadialLineAxis.log_scale
Use logarithmic scale for this axis.
Example usage:
>>> # get axis via "plot.axes.x_axis(0)" for line plots >>> # or "plot.axes.x_axis" for field or sketch plots >>> # or "plot.axes.r_axis" for the radial axis in polar plots >>> axis.log_scale = True
- Type:
- RadialLineAxis.marker_grid_line
Marker line to indicate a particular position along an axis.
Example usage:
>>> # get axis via "plot.axes.x_axis(0)" for line plots >>> # or "plot.axes.x_axis" for field or sketch plots >>> axis.marker_grid_line.show = True >>> axis.marker_grid_line.position = 0.5
- Type:
- RadialLineAxis.max
Upper bound of this axis’ range.
Example usage:
>>> # get axis via "plot.axes.x_axis(0)" for line plots >>> # or "plot.axes.x_axis" for field or sketch plots >>> axis.max = 1.0
- Type:
- RadialLineAxis.min
Lower bound of this axis’ range.
Example usage:
>>> # get axis via "plot.axes.x_axis(0)" for line plots >>> # or "plot.axes.x_axis" for field or sketch plots >>> axis.min = 0.0
- Type:
- RadialLineAxis.minor_grid_lines
Minor grid lines style control.
Minor grid lines are attached to the locations of the minor ticks. Example usage:
>>> # get axis via "plot.axes.x_axis(0)" for line plots >>> # or "plot.axes.x_axis" for field or sketch plots >>> axis.minor_grid_lines.show = True
- Type:
- RadialLineAxis.origin
Value at the origin of the axis.
Example usage:
# value at center of plot equal to 10 >>> plot.axes.r_axis.origin = 10 # rotate theta axis 45 degrees clockwise >>> plot.axes.theta_axis.origin = 45
- Type:
- RadialLineAxis.reverse
Reverse the direction of the axis scale.
Example usage:
>>> # get axis via "plot.axes.x_axis(0)" for line plots >>> # or "plot.axes.x_axis" for field or sketch plots >>> axis.reverse = True
- Type:
- RadialLineAxis.show
Enable drawing of this axis.
Example usage:
>>> # get axis via "plot.axes.x_axis(0)" for line plots >>> # or "plot.axes.x_axis" for field or sketch plots >>> axis.show = True
- Type:
- RadialLineAxis.tick_labels
Axis ticks labels style control.
Example usage:
>>> plot.axes.r_axis.tick_labels.show = False
- Type:
- RadialLineAxis.ticks
Axis major and minor ticks style control.
Example usage:
>>> plot.axes.r_axis.ticks.line_thickness = 0.8
- Type:
PolarAngleLineAxis
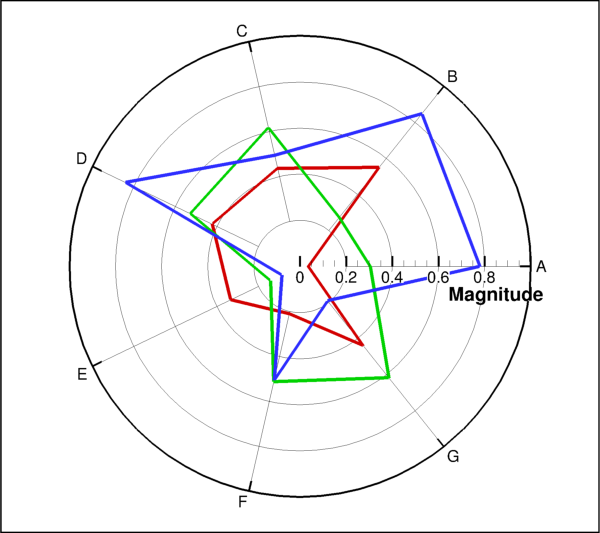
- class tecplot.plot.PolarAngleLineAxis(axes)[source]
Theta axis for polar plots.
This example manipulates both the theta and radial axes to produce a star plot. Custom labels are created for each data point:
import numpy as np import tecplot as tp from tecplot.constant import PlotType, ThetaMode, NumberFormat, AxisAlignment np.random.seed(2) npoints = 7 theta = np.linspace(0, npoints, npoints+1) frame = tp.active_frame() dataset = frame.create_dataset('Data', ['Magnitude', 'Property']) for i in range(3): r = list(np.random.uniform(0.01, 0.99, npoints)) r.append(r[0]) zone = dataset.add_ordered_zone('Zone {}'.format(i), (npoints+1,)) zone.values('Magnitude')[:] = r zone.values('Property')[:] = theta plot = frame.plot(PlotType.PolarLine) plot.activate() plot.delete_linemaps() for i, zone in enumerate(dataset.zones()): lmap = plot.add_linemap('Linemap {}'.format(i), zone, dataset.variable('Magnitude'), dataset.variable('Property')) lmap.line.line_thickness = 0.8 r_axis = plot.axes.r_axis r_axis.max = 1 r_axis.line.show = False r_axis.title.position = 85 r_axis.line.alignment = AxisAlignment.WithOpposingAxisValue r_axis.line.opposing_axis_value = 1 theta_axis = plot.axes.theta_axis theta_axis.origin = 1 theta_axis.mode = ThetaMode.Arbitrary theta_axis.min = 0 theta_axis.max = theta.max() theta_axis.period = npoints theta_axis.ticks.auto_spacing = False theta_axis.ticks.spacing = 1 theta_axis.ticks.minor_num_ticks = 0 theta_axis.title.show = False theta_labels = theta_axis.tick_labels.format theta_labels.format_type = NumberFormat.CustomLabel theta_labels.add_custom_labels('A', 'B', 'C', 'D', 'E', 'F', 'G') theta_labels.custom_labels_index = 0 plot.view.fit() tp.export.save_png('star_plot.png', 600, supersample=3)
Attributes
Do not show data outside the axes area.
Theta angle major grid lines.
Axis line style control.
Theta angle marker grid line.
Upper bound of this axis' range.
Lower bound of this axis' range.
Theta angle minor grid lines.
Units or scale used for the theta axis.
Value at the origin of the axis.
Number of (min, max) cycles to include in 360 degrees.
Reverse the direction of the axis scale.
Enable drawing of this axis.
Axis ticks labels style control.
Axis major and minor ticks style control.
Axis title.
Methods
Rounds the axis range to the nearest major axis increment.
Set range of axis to variable minimum and maximum.
Set range of axis to nice values near variable minimum and maximum.
Set theta range to entire circle.
- PolarAngleLineAxis.adjust_range_to_nice()
Rounds the axis range to the nearest major axis increment.
This method resets the axis-line label values such that all currently displayed label values are set to have the smallest number of significant digits possible.
Example usage:
>>> # get axis via "plot.axes.x_axis(0)" for line plots >>> # or "plot.axes.x_axis" for field or sketch plots >>> axis.adjust_range_to_nice()
- PolarAngleLineAxis.clip_data
Do not show data outside the axes area.
Example usage:
>>> plot.axes.clip_data = True
- Type:
- PolarAngleLineAxis.fit_range()
Set range of axis to variable minimum and maximum.
Note
If the axis dependency is not
Independent, then this action may also affect the range on another axis.Example usage:
>>> # get axis via "plot.axes.x_axis(0)" for line plots >>> # or "plot.axes.x_axis" for field or sketch plots >>> axis.fit_range()
- PolarAngleLineAxis.fit_range_to_nice()
Set range of axis to nice values near variable minimum and maximum.
This method resets the range to equal the minimum and maximum of the data being plotted, but makes the axis values “nice” by setting labels to have the smallest number of significant digits possible,
Note
If the axis dependency is not independent then this method may also affect the range on another axis.
Example usage:
>>> # get axis via "plot.axes.x_axis(0)" for line plots >>> # or "plot.axes.x_axis" for field or sketch plots >>> axis.fit_range_to_nice()
- PolarAngleLineAxis.grid_lines
Theta angle major grid lines.
Example usage:
>>> plot.axes.theta_axis.grid_lines.show = True
- Type:
- PolarAngleLineAxis.line
Axis line style control.
Example usage:
>>> plot.axes.r_axis.line.line_thickness = 0.6 >>> plot.axes.theta_axis.line.line_thickness = 0.6
- Type:
- PolarAngleLineAxis.marker_grid_line
Theta angle marker grid line.
Example usage:
>>> plot.axes.theta_axis.marker_grid_line.show = True
- Type:
- PolarAngleLineAxis.max
Upper bound of this axis’ range.
Example usage:
>>> # get axis via "plot.axes.x_axis(0)" for line plots >>> # or "plot.axes.x_axis" for field or sketch plots >>> axis.max = 1.0
- Type:
- PolarAngleLineAxis.min
Lower bound of this axis’ range.
Example usage:
>>> # get axis via "plot.axes.x_axis(0)" for line plots >>> # or "plot.axes.x_axis" for field or sketch plots >>> axis.min = 0.0
- Type:
- PolarAngleLineAxis.minor_grid_lines
Theta angle minor grid lines.
Example usage:
>>> plot.axes.theta_axis.minor_grid_lines.show = True
- Type:
- PolarAngleLineAxis.mode
Units or scale used for the theta axis.
Possible values:
ThetaMode.Degrees,ThetaMode.Radians,ThetaMode.Arbitrary.Example usage:
>>> from tecplot.constant import ThetaMode >>> plot.axes.theta_axis.mode = ThetaMode.Radians
- Type:
- PolarAngleLineAxis.origin
Value at the origin of the axis.
Example usage:
# value at center of plot equal to 10 >>> plot.axes.r_axis.origin = 10 # rotate theta axis 45 degrees clockwise >>> plot.axes.theta_axis.origin = 45
- Type:
- PolarAngleLineAxis.period
Number of (min, max) cycles to include in 360 degrees.
Example usage:
>>> plot.axes.theta_axis.period = 2
- Type:
- PolarAngleLineAxis.reverse
Reverse the direction of the axis scale.
Example usage:
>>> # get axis via "plot.axes.x_axis(0)" for line plots >>> # or "plot.axes.x_axis" for field or sketch plots >>> axis.reverse = True
- Type:
- PolarAngleLineAxis.set_range_to_entire_circle()[source]
Set theta range to entire circle.
Example usage:
>>> plot.axes.theta_axis.set_range_to_entire_circle()
- PolarAngleLineAxis.show
Enable drawing of this axis.
Example usage:
>>> # get axis via "plot.axes.x_axis(0)" for line plots >>> # or "plot.axes.x_axis" for field or sketch plots >>> axis.show = True
- Type:
- PolarAngleLineAxis.tick_labels
Axis ticks labels style control.
Example usage:
>>> # get axis via "plot.axes.x_axis(0)" for line plots >>> # or "plot.axes.x_axis" for field or sketch plots >>> axis.tick_labels.show = False
- Type:
- PolarAngleLineAxis.ticks
Axis major and minor ticks style control.
Example usage:
>>> # get axis via "plot.axes.x_axis(0)" for line plots >>> # or "plot.axes.x_axis" for field or sketch plots >>> axis.ticks.line_thickness = 0.8
- Type:
Sketch Axes
SketchAxes
- class tecplot.plot.SketchAxes(plot)[source]
(X, Y) axes style control for sketch plots.
Sketch plots have cartesian x and y axes which can be adjusted using the viewport:
import tecplot as tp from tecplot.constant import PlotType frame = tp.active_frame() plot = frame.plot(PlotType.Sketch) plot.axes.x_axis.show = True plot.axes.y_axis.show = True plot.axes.viewport.left = 10 plot.axes.viewport.right = 90 plot.axes.viewport.bottom = 10 plot.axes.viewport.top = 90 tp.export.save_png('axes_sketch.png', 600, supersample=3)

Attributes
Automatically adjust axis ranges to nice values.
Controls automatic adjustment of axis ranges.
Area bounded by the axes.
Precise dot grid.
Preserve scale (spacing between ticks) on range change.
Area of the frame used by the plot axes.
X-axis style control.
X:Y axis scaling ratio in percent.
Y-axis style control.
- SketchAxes.auto_adjust_ranges
Automatically adjust axis ranges to nice values.
Axes limits will be adjusted to have the smallest number of significant digits possible:
>>> plot.axes.auto_adjust_ranges = False
- Type:
- SketchAxes.axis_mode
Controls automatic adjustment of axis ranges.
Possible values:
Independent,XYDependent.If set to
XYDependent, then setting the range of one axis automatically scales the other indicated axes proportionally to maintain the aspect ratio of the plot, effectively zooming in or out. If set toIndependent, adjusting the range of one axis has no effect on other axes. Defaults toIndependentfor XY line plots,XYDependentfor 2D Cartesian plots. Example usage:>>> from tecplot.constant import AxisMode >>> plot.axes.axis_mode = AxisMode.Independent
- Type:
- SketchAxes.grid_area
Area bounded by the axes.
This controls the background color and border of the axes:
>>> from tecplot.constant import Color >>> plot.axes.grid_area.fill_color = Color.LightGreen
- Type:
- SketchAxes.precise_grid
Precise dot grid.
This is a set of small dots drawn at the intersection of every minor gridline. In line plots, the axis assignments for the first active mapping govern the precise dot grid. The precise dot grid option is disabled for the 3D Cartesian plots and Line plots when either axis for the first active line mapping uses a log scale:
>>> plot.axes.precise_grid.show = True
- Type:
- SketchAxes.preserve_scale
Preserve scale (spacing between ticks) on range change.
This maintains the axis scaling, i.e. the distance between values along the axis. If
False, the axes length will be preserved when the range changes:>>> plot.axes.preserve_scale = False >>> # get axis via "plot.axes.x_axis(0)" for line plots >>> # or "plot.axes.x_axis" for field or sketch plots >>> axis.max = 10 # axis scale is changed (length is preserved)
- Type:
- SketchAxes.viewport
Area of the frame used by the plot axes.
Example usage:
>>> plot.axes.viewport.left = 5 >>> plot.axes.viewport.right = 95 >>> plot.axes.viewport.top = 95 >>> plot.axes.viewport.bottom = 5
- Type:
- SketchAxes.x_axis
X-axis style control.
Example usage:
>>> plot.axes.x_axis.show = True
- Type:
- SketchAxes.xy_ratio
X:Y axis scaling ratio in percent.
This requires the axes to be in dependent mode:
>>> from tecplot.constant import AxisMode
>>> plot.axes.axis_mode = AxisMode.XYDependent
>>> plot.axes.xy_ratio = 2
- Type:
- SketchAxes.y_axis
Y-axis style control.
Example usage:
>>> plot.axes.y_axis.show = True
- Type:
SketchAxis
- class tecplot.plot.SketchAxis(axes, name, **kwargs)[source]
X or Y axis for sketch plots.
import tecplot as tp from tecplot.constant import PlotType plot = tp.active_frame().plot(PlotType.Sketch) viewport = plot.axes.viewport viewport.left = 10 viewport.right = 90 viewport.bottom = 10 xaxis = plot.axes.x_axis xaxis.show = True xaxis.min = 0 xaxis.max = 360 xaxis.title.text = 'Angle (Degrees)' xaxis.ticks.auto_spacing = False xaxis.ticks.spacing = 60 tp.export.save_png('axis_sketch.png', 600, supersample=3)
Attributes
Major grid lines style control.
Axis line style control.
Use logarithmic scale for this axis.
Marker line to indicate a particular position along an axis.
Upper bound of this axis' range.
Lower bound of this axis' range.
Minor grid lines style control.
Enable drawing of this axis.
Axis ticks labels style control.
Axis major and minor ticks style control.
Axis title.
Methods
Rounds the axis range to the nearest major axis increment.
Set range of axis to variable minimum and maximum.
Set range of axis to nice values near variable minimum and maximum.
- SketchAxis.adjust_range_to_nice()
Rounds the axis range to the nearest major axis increment.
This method resets the axis-line label values such that all currently displayed label values are set to have the smallest number of significant digits possible.
Example usage:
>>> # get axis via "plot.axes.x_axis(0)" for line plots
>>> # or "plot.axes.x_axis" for field or sketch plots
>>> axis.adjust_range_to_nice()
- SketchAxis.fit_range()
Set range of axis to variable minimum and maximum.
Note
If the axis dependency is not
Independent, then this action may also affect the range on another axis.Example usage:
>>> # get axis via "plot.axes.x_axis(0)" for line plots
>>> # or "plot.axes.x_axis" for field or sketch plots
>>> axis.fit_range()
- SketchAxis.fit_range_to_nice()
Set range of axis to nice values near variable minimum and maximum.
This method resets the range to equal the minimum and maximum of the data being plotted, but makes the axis values “nice” by setting labels to have the smallest number of significant digits possible,
Note
If the axis dependency is not independent then this method may also affect the range on another axis.
Example usage:
>>> # get axis via "plot.axes.x_axis(0)" for line plots
>>> # or "plot.axes.x_axis" for field or sketch plots
>>> axis.fit_range_to_nice()
- SketchAxis.grid_lines
Major grid lines style control.
Major grid lines are attached to the locations of the major ticks. See
minor_grid_linesfor lines attached to minor ticks. Example usage:>>> # get axis via "plot.axes.x_axis(0)" for line plots >>> # or "plot.axes.x_axis" for field or sketch plots >>> axis.grid_lines.show = True
- Type:
- SketchAxis.line
Axis line style control.
Example usage:
>>> # get axis via "plot.axes.x_axis(0)" for line plots >>> # or "plot.axes.x_axis" for field or sketch plots >>> axis.line.line_thickness = 0.6
- Type:
- SketchAxis.log_scale
Use logarithmic scale for this axis.
Example usage:
>>> # get axis via "plot.axes.x_axis(0)" for line plots >>> # or "plot.axes.x_axis" for field or sketch plots >>> # or "plot.axes.r_axis" for the radial axis in polar plots >>> axis.log_scale = True
- Type:
- SketchAxis.marker_grid_line
Marker line to indicate a particular position along an axis.
Example usage:
>>> # get axis via "plot.axes.x_axis(0)" for line plots >>> # or "plot.axes.x_axis" for field or sketch plots >>> axis.marker_grid_line.show = True >>> axis.marker_grid_line.position = 0.5
- Type:
- SketchAxis.max
Upper bound of this axis’ range.
Example usage:
>>> # get axis via "plot.axes.x_axis(0)" for line plots
>>> # or "plot.axes.x_axis" for field or sketch plots
>>> axis.max = 1.0
- Type:
- SketchAxis.min
Lower bound of this axis’ range.
Example usage:
>>> # get axis via "plot.axes.x_axis(0)" for line plots
>>> # or "plot.axes.x_axis" for field or sketch plots
>>> axis.min = 0.0
- Type:
- SketchAxis.minor_grid_lines
Minor grid lines style control.
Minor grid lines are attached to the locations of the minor ticks. Example usage:
>>> # get axis via "plot.axes.x_axis(0)" for line plots >>> # or "plot.axes.x_axis" for field or sketch plots >>> axis.minor_grid_lines.show = True
- Type:
- SketchAxis.show
Enable drawing of this axis.
Example usage:
>>> # get axis via "plot.axes.x_axis(0)" for line plots
>>> # or "plot.axes.x_axis" for field or sketch plots
>>> axis.show = True
- Type:
- SketchAxis.tick_labels
Axis ticks labels style control.
Example usage:
>>> # get axis via "plot.axes.x_axis(0)" for line plots
>>> # or "plot.axes.x_axis" for field or sketch plots
>>> axis.tick_labels.show = False
- Type:
- SketchAxis.ticks
Axis major and minor ticks style control.
Example usage:
>>> # get axis via "plot.axes.x_axis(0)" for line plots
>>> # or "plot.axes.x_axis" for field or sketch plots
>>> axis.ticks.line_thickness = 0.8
- Type:
Axis Elements
Axis Line
AxisLine2D
- class tecplot.plot.AxisLine2D(axis)[source]
Graduated axis line for 2D plots.
Cartesian (x, y) plots use an extension of this class (
Cartesian2DAxisLine). Polar plots use this class directly:import numpy as np import tecplot as tp from tecplot.constant import PlotType, ThetaMode npoints = 300 r = np.linspace(0, 2000, npoints) theta = np.linspace(0, 10, npoints) frame = tp.active_frame() dataset = frame.create_dataset('Data', ['R', 'Theta']) zone = dataset.add_ordered_zone('Zone', (300,)) zone.values('R')[:] = r zone.values('Theta')[:] = theta plot = frame.plot(PlotType.PolarLine) plot.activate() plot.delete_linemaps() lmap = plot.add_linemap('Linemap', zone, dataset.variable('R'), dataset.variable('Theta')) lmap.line.line_thickness = 0.8 r_axis = plot.axes.r_axis r_axis.max = np.max(r) r_axis.tick_labels.angle = 45 r_axis.tick_labels.font.size *= 2 theta_axis = plot.axes.theta_axis theta_axis.mode = ThetaMode.Radians theta_axis.tick_labels.font.size *= 2 plot.view.fit() tp.export.save_png('axis_line_2d.png', 600, supersample=3)

Attributes
Axis line placement.
Color of the axis line.
Width of the axis line to be drawn.
Axis line placement with respect to the grid border.
Axis line placement with respect to the opposing axis.
Draw the primary axis line on the plot.
- AxisLine2D.alignment
Axis line placement.
Possible values:
WithViewport,WithOpposingAxisValue,WithGridMin,WithGridMax,WithGridAreaTop,WithGridAreaBottom,WithGridAreaLeftorWithGridAreaRight.Not all values will be available for every plot type. Example usage:
>>> from tecplot.constant import AxisAlignment
>>> # get axis via "plot.axes.x_axis(0)" for line plots
>>> # or "plot.axes.x_axis" for field or sketch plots
>>> axis.line.alignment = AxisAlignment.WithGridMin
- Type:
- AxisLine2D.color
Color of the axis line.
Example usage:
>>> from tecplot.constant import Color
>>> # get axis via "plot.axes.x_axis(0)" for line plots
>>> # or "plot.axes.x_axis" for field or sketch plots
>>> axis.line.color = Color.Blue
- Type:
- AxisLine2D.line_thickness
Width of the axis line to be drawn.
Example usage:
>>> # get axis via "plot.axes.x_axis(0)" for line plots
>>> # or "plot.axes.x_axis" for field or sketch plots
>>> axis.line.line_thickness = 0.5
- Type:
- AxisLine2D.offset
Axis line placement with respect to the grid border.
This is the offset from the grid border-aligned position dictated by properties such as
AxisLine2D.alignment. The example moves the axis line into the plot by 5% of the frame height:>>> # get axis via "plot.axes.x_axis(0)" for line plots >>> # or "plot.axes.x_axis" for field or sketch plots >>> axis.line.offset = -5
- Type:
float(percent of frame height)
- AxisLine2D.opposing_axis_value
Axis line placement with respect to the opposing axis.
The axis alignment must be set to
AxisAlignment.WithOpposingAxisValueto make this property relevant:>>> from tecplot.constant import AxisAlignment >>> # get axis via "plot.axes.x_axis(0)" for line plots >>> # or "plot.axes.x_axis" for field or sketch plots >>> axis.line.alignment = AxisAlignment.WithOpposingAxisValue >>> axis.line.opposing_axis_value = 0.5
- Type:
Cartesian2DAxisLine
- class tecplot.plot.Cartesian2DAxisLine(axis)[source]
Axis line for 2D field plots.
from os import path import tecplot as tp from tecplot.constant import PlotType, Color, AxisAlignment examples_dir = tp.session.tecplot_examples_directory() infile = path.join(examples_dir, 'SimpleData', 'CircularContour.plt') dataset = tp.data.load_tecplot(infile) plot = tp.active_frame().plot(PlotType.Cartesian2D) plot.activate() plot.show_contour = True plot.contour(0).colormap_name = 'Sequential - Yellow/Green/Blue' plot.axes.preserve_scale = True plot.axes.x_axis.fit_range() for ax in plot.axes: line = ax.line line.color = Color.DeepRed line.alignment = AxisAlignment.WithOpposingAxisValue line.opposing_axis_value = 0 ax.title.position = 85 plot.contour(0).levels.reset_to_nice() tp.export.save_png('axis_line_cartesian2d.png', 600, supersample=3)

Attributes
Axis line placement.
Color of the axis line.
Width of the axis line to be drawn.
Axis line placement with respect to the grid border.
Axis line placement with respect to the opposing axis.
Axis line placement with respect to the viewport.
Draw the primary axis line on the plot.
- Cartesian2DAxisLine.alignment
Axis line placement.
Possible values:
WithViewport,WithOpposingAxisValue,WithGridMin,WithGridMax,WithGridAreaTop,WithGridAreaBottom,WithGridAreaLeftorWithGridAreaRight.Not all values will be available for every plot type. Example usage:
>>> from tecplot.constant import AxisAlignment >>> # get axis via "plot.axes.x_axis(0)" for line plots >>> # or "plot.axes.x_axis" for field or sketch plots >>> axis.line.alignment = AxisAlignment.WithGridMin
- Type:
- Cartesian2DAxisLine.color
Color of the axis line.
Example usage:
>>> from tecplot.constant import Color >>> # get axis via "plot.axes.x_axis(0)" for line plots >>> # or "plot.axes.x_axis" for field or sketch plots >>> axis.line.color = Color.Blue
- Type:
- Cartesian2DAxisLine.line_thickness
Width of the axis line to be drawn.
Example usage:
>>> # get axis via "plot.axes.x_axis(0)" for line plots >>> # or "plot.axes.x_axis" for field or sketch plots >>> axis.line.line_thickness = 0.5
- Type:
- Cartesian2DAxisLine.offset
Axis line placement with respect to the grid border.
This is the offset from the grid border-aligned position dictated by properties such as
AxisLine2D.alignment. The example moves the axis line into the plot by 5% of the frame height:>>> # get axis via "plot.axes.x_axis(0)" for line plots >>> # or "plot.axes.x_axis" for field or sketch plots >>> axis.line.offset = -5
- Type:
float(percent of frame height)
- Cartesian2DAxisLine.opposing_axis_value
Axis line placement with respect to the opposing axis.
The axis alignment must be set to
AxisAlignment.WithOpposingAxisValueto make this property relevant:>>> from tecplot.constant import AxisAlignment >>> # get axis via "plot.axes.x_axis(0)" for line plots >>> # or "plot.axes.x_axis" for field or sketch plots >>> axis.line.alignment = AxisAlignment.WithOpposingAxisValue >>> axis.line.opposing_axis_value = 0.5
- Type:
- Cartesian2DAxisLine.position
Axis line placement with respect to the viewport.
The axis alignment must be set to
AxisAlignment.WithViewportto make this property relevant:>>> from tecplot.constant import AxisAlignment >>> # get axis via "plot.axes.x_axis(0)" for line plots >>> # or "plot.axes.x_axis" for field or sketch plots >>> axis.line.alignment = AxisAlignment.WithViewport >>> axis.line.position = 0.5
- Type:
AxisLine3D
- class tecplot.plot.AxisLine3D(axis)[source]
X, Y or Z axis for 3D field plots.
This represents the line along which ticks and labels are drawn. The color affects the line itself and the associated tick marks but not labels or axis titles:
from os import path import tecplot as tp from tecplot.constant import PlotType, Color examples_dir = tp.session.tecplot_examples_directory() infile = path.join(examples_dir, 'SimpleData', 'Sphere.lpk') dataset = tp.load_layout(infile) frame = tp.active_frame() plot = frame.plot() plot.show_mesh = False plot.axes.grid_area.fill_color = Color.Grey for ax in [plot.axes.x_axis, plot.axes.y_axis, plot.axes.z_axis]: ax.show = True ax.grid_lines.show = False ax.line.color = Color.Cyan ax.line.line_thickness = 0.2 ax.line.show_on_opposite_edge = True plot.view.fit() tp.export.save_png('axis_line_3d.png', 600, supersample=3)
Attributes
Color of the axis line.
Edge to use when drawing the primary axis line.
Width of the axis line to be drawn.
Draw the primary axis line on the plot.
Draw axis line on opposite edge of axes box.
- AxisLine3D.color
Color of the axis line.
Example usage:
>>> from tecplot.constant import Color >>> # get axis via "plot.axes.x_axis(0)" for line plots >>> # or "plot.axes.x_axis" for field or sketch plots >>> axis.line.color = Color.Blue
- Type:
- AxisLine3D.edge_assignment
Edge to use when drawing the primary axis line.
Possible values:
AxisLine3DAssignment.Automatic(aliased toNone),YMinZMin,YMaxZMin,YMinZMax,YMaxZMax.Example usage:
>>> from tecplot.constant import AxisLine3DAssignment >>> axis.line.edge_assignment = AxisLine3DAssignment.YMinZMin
- Type:
- AxisLine3D.line_thickness
Width of the axis line to be drawn.
Example usage:
>>> # get axis via "plot.axes.x_axis(0)" for line plots >>> # or "plot.axes.x_axis" for field or sketch plots >>> axis.line.line_thickness = 0.5
- Type:
- AxisLine3D.show
Draw the primary axis line on the plot.
Example usage:
>>> # get axis via "plot.axes.x_axis(0)" for line plots
>>> # or "plot.axes.x_axis" for field or sketch plots
>>> axis.line.show = False
- Type:
RadialAxisLine2D
- class tecplot.plot.RadialAxisLine2D(axis)[source]
Radial axis line for polar plots.
import numpy as np import tecplot as tp from tecplot.constant import PlotType, Color npoints = 300 r = np.linspace(0, 2000, npoints) theta = np.linspace(0, 700, npoints) frame = tp.active_frame() dataset = frame.create_dataset('Data', ['R', 'Theta']) zone = dataset.add_ordered_zone('Zone', (300,)) zone.values('R')[:] = r zone.values('Theta')[:] = theta plot = frame.plot(PlotType.PolarLine) plot.activate() plot.axes.r_axis.max = np.max(r) plot.delete_linemaps() lmap = plot.add_linemap('Linemap', zone, dataset.variable('R'), dataset.variable('Theta')) lmap.line.line_thickness = 0.8 raxis = plot.axes.r_axis raxis.line.show_both_directions = True raxis.line.show_perpendicular = True plot.view.fit() tp.export.save_png('axis_line_radial.png', 600, supersample=3)

Attributes
Axis line placement.
Specific angle to place the radial axis line.
Color of the axis line.
Width of the axis line to be drawn.
Axis line placement with respect to the grid border.
Axis line placement with respect to the opposing axis.
Draw the primary axis line on the plot.
Mirror the radial axis 180 degrees from the primary line.
Mirror the radial axis 90 degrees from the primary line.
- RadialAxisLine2D.alignment
Axis line placement.
Possible values:
WithOpposingAxisValue,WithGridMin,WithGridMax,WithSpecificAngle,WithGridAreaTop,WithGridAreaBottom,WithGridAreaLeftorWithGridAreaRight.Not all values will be available for every plot type. Example usage:
>>> from tecplot.constant import AxisAlignment >>> plot.r_axis.line.alignment = AxisAlignment.WithOpposingAxisValue >>> plot.r_axis.line.opposing_axis_value = 45
- Type:
- RadialAxisLine2D.angle
Specific angle to place the radial axis line.
The alignment must be set to
AxisAlignment.WithSpecificAngle:>>> from tecplot.constant import AxisAlignment >>> plot.r_axis.line.alignment = AxisAlignment.WithSpecificAngle >>> plot.r_axis.line.angle = 45
- Type:
- RadialAxisLine2D.color
Color of the axis line.
Example usage:
>>> from tecplot.constant import Color
>>> # get axis via "plot.axes.x_axis(0)" for line plots
>>> # or "plot.axes.x_axis" for field or sketch plots
>>> axis.line.color = Color.Blue
- Type:
- RadialAxisLine2D.line_thickness
Width of the axis line to be drawn.
Example usage:
>>> # get axis via "plot.axes.x_axis(0)" for line plots
>>> # or "plot.axes.x_axis" for field or sketch plots
>>> axis.line.line_thickness = 0.5
- Type:
- RadialAxisLine2D.offset
Axis line placement with respect to the grid border.
This is the offset from the grid border-aligned position dictated by properties such as
AxisLine2D.alignment. The example moves the axis line into the plot by 5% of the frame height:>>> # get axis via "plot.axes.x_axis(0)" for line plots >>> # or "plot.axes.x_axis" for field or sketch plots >>> axis.line.offset = -5
- Type:
float(percent of frame height)
- RadialAxisLine2D.opposing_axis_value
Axis line placement with respect to the opposing axis.
The axis alignment must be set to
AxisAlignment.WithOpposingAxisValueto make this property relevant:>>> from tecplot.constant import AxisAlignment >>> # get axis via "plot.axes.x_axis(0)" for line plots >>> # or "plot.axes.x_axis" for field or sketch plots >>> axis.line.alignment = AxisAlignment.WithOpposingAxisValue >>> axis.line.opposing_axis_value = 0.5
- Type:
- RadialAxisLine2D.show
Draw the primary axis line on the plot.
Example usage:
>>> # get axis via "plot.axes.x_axis(0)" for line plots
>>> # or "plot.axes.x_axis" for field or sketch plots
>>> axis.line.show = False
- Type:
- RadialAxisLine2D.show_both_directions
Mirror the radial axis 180 degrees from the primary line.
If
RadialAxisLine2D.show_perpendicularisTrue, this will mirror that axis line as well resulting in four axis lines, 90 degrees apart. Example usage:>>> r_axis.line.show_both_directions = True
- Type:
Ticks and Labels
Ticks2D
- class tecplot.plot.Ticks2D(axis)[source]
Tick marks (major and minor) along axes in 2D.
import tecplot as tp
from os import path
from tecplot.constant import PlotType, AxisMode, AxisAlignment, TickDirection

examples_dir = tp.session.tecplot_examples_directory()
infile = path.join(examples_dir, 'SimpleData', 'CircularContour.plt')
dataset = tp.data.load_tecplot(infile)

frame = tp.active_frame()
plot = frame.plot(PlotType.Cartesian2D)

plot.show_contour = True
plot.contour(0).colormap_name = 'Sequential - Yellow/Green/Blue'

plot.axes.x_axis.line.show = False

yaxis = plot.axes.y_axis
yaxis.max = 0.15
yaxis.line.show = False
yaxis.line.alignment = AxisAlignment.WithOpposingAxisValue
yaxis.line.opposing_axis_value = 0
yaxis.tick_labels.transparent_background = True
yaxis.tick_labels.offset = -5

yticks = yaxis.ticks
yticks.direction = TickDirection.Centered

for ticks in [plot.axes.x_axis.ticks, yticks]:
    ticks.auto_spacing = False
    ticks.spacing = 0.5
    ticks.minor_num_ticks = 3
    ticks.length *= 3
    ticks.line_thickness *= 2

plot.view.fit()

# ensure consistent output between interactive (connected) and batch
plot.contour(0).levels.reset_to_nice()

tp.export.save_png('ticks_2d.png', 600, supersample=3)
Attributes
Automatically set the spacing between tick marks.
How to draw the ticks with respect the axis line.
Size of the major tick lines to draw.
Width of the major tick lines to be drawn.
Size of the minor tick lines to draw.
Width of the minor tick lines to be drawn.
Number of minor ticks between each major tick.
Draw ticks along axis.
Draw ticks along the upper border of the axes grid.
Draw ticks along the lower border of the axes grid.
Distance between major ticks.
Value to place the first major tick mark.
- Ticks2D.auto_spacing
Automatically set the spacing between tick marks.
Example usage:
>>> axis.ticks.auto_spacing = True
- Type:
- Ticks2D.direction
How to draw the ticks with respect the axis line.
Possible values:
TickDirection.In,TickDirection.OutorTickDirection.Centered:>>> from tecplot.constant import TickDirection >>> axis.ticks.direction = TickDirection.Centered
- Type:
- Ticks2D.length
Size of the major tick lines to draw.
Example usage:
>>> axis.ticks.length = 2
- Type:
float(percent of frame height)
- Ticks2D.line_thickness
Width of the major tick lines to be drawn.
Example usage:
>>> axis.ticks.line_thickness = 0.4
- Type:
- Ticks2D.minor_length
Size of the minor tick lines to draw.
Example usage:
>>> axis.ticks.minor_length = 1.2
- Type:
float(percent of frame height)
- Ticks2D.minor_line_thickness
Width of the minor tick lines to be drawn.
Example usage:
>>> axis.ticks.minor_line_thickness = 0.1
- Type:
- Ticks2D.minor_num_ticks
Number of minor ticks between each major tick.
Example usage:
>>> axis.ticks.minor_num_ticks = 3
- Type:
- Ticks2D.show_on_border_max
Draw ticks along the upper border of the axes grid.
Example usage:
>>> axis.ticks.show_on_border_max = True
- Type:
- Ticks2D.show_on_border_min
Draw ticks along the lower border of the axes grid.
Example usage:
>>> axis.ticks.show_on_border_min = True
- Type:
Ticks3D
- class tecplot.plot.Ticks3D(axis)[source]
Tick marks (major and minor) along axes in 3D.
from os import path
import tecplot as tp
from tecplot.constant import PlotType, TickDirection

examples_dir = tp.session.tecplot_examples_directory()
infile = path.join(examples_dir, 'SimpleData', 'F18.plt')
dataset = tp.data.load_tecplot(infile)

frame = tp.active_frame()
plot = frame.plot(PlotType.Cartesian3D)
plot.activate()

plot.show_contour = True
plot.contour(0).legend.show = False
plot.axes.grid_area.filled = False

for axis in plot.axes:
    axis.show = True
    axis.grid_lines.show = False

    axis.ticks.length *= 4
    axis.ticks.minor_length *= 4

plot.view.fit()

tp.export.save_png('ticks_3d.png', 600, supersample=3)

Attributes
Automatically set the spacing between tick marks.
How to draw the ticks with respect the axis line.
Size of the major tick lines to draw.
Width of the major tick lines to be drawn.
Size of the minor tick lines to draw.
Width of the minor tick lines to be drawn.
Number of minor ticks between each major tick.
Draw ticks along axis.
Draw ticks along the opposite border of the axes grid.
Distance between major ticks.
Value to place the first major tick mark.
- Ticks3D.auto_spacing
Automatically set the spacing between tick marks.
Example usage:
>>> axis.ticks.auto_spacing = True
- Type:
- Ticks3D.direction
How to draw the ticks with respect the axis line.
Possible values:
TickDirection.In,TickDirection.OutorTickDirection.Centered:>>> from tecplot.constant import TickDirection >>> axis.ticks.direction = TickDirection.Centered
- Type:
- Ticks3D.length
Size of the major tick lines to draw.
Example usage:
>>> axis.ticks.length = 2
- Type:
float(percent of frame height)
- Ticks3D.line_thickness
Width of the major tick lines to be drawn.
Example usage:
>>> axis.ticks.line_thickness = 0.4
- Type:
- Ticks3D.minor_length
Size of the minor tick lines to draw.
Example usage:
>>> axis.ticks.minor_length = 1.2
- Type:
float(percent of frame height)
- Ticks3D.minor_line_thickness
Width of the minor tick lines to be drawn.
Example usage:
>>> axis.ticks.minor_line_thickness = 0.1
- Type:
- Ticks3D.minor_num_ticks
Number of minor ticks between each major tick.
Example usage:
>>> axis.ticks.minor_num_ticks = 3
- Type:
- Ticks3D.show_on_opposite_edge
Draw ticks along the opposite border of the axes grid.
Example usage:
>>> axis.ticks.show_on_opposite_edge = True
- Type:
RadialTicks
- class tecplot.plot.RadialTicks(axis)[source]
Tick marks (major and minor) along the radial axis.
from os import path
import tecplot as tp
from tecplot.constant import PlotType, ThetaMode, Color, TickDirection

examples_dir = tp.session.tecplot_examples_directory()
datafile = path.join(examples_dir, 'SimpleData', 'IndependentDependent.lpk')
dataset = tp.load_layout(datafile)

plot = tp.active_frame().plot(PlotType.PolarLine)
plot.activate()

plot.axes.theta_axis.mode = ThetaMode.Radians

raxis = plot.axes.r_axis
raxis.line.color = Color.Red
raxis.tick_labels.offset = -4

raxis.ticks.direction =TickDirection.Centered
raxis.ticks.line_thickness = 0.8
raxis.ticks.length = 4
raxis.ticks.minor_length = 4

tp.export.save_png('ticks_radial.png', 600, supersample=3)
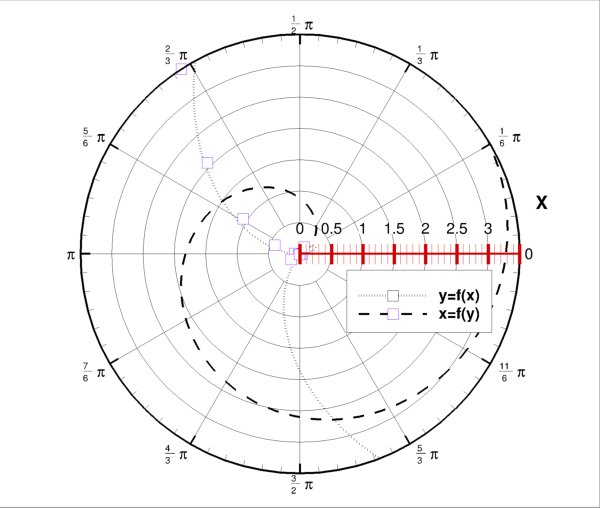
Attributes
Automatically set the spacing between tick marks.
How to draw the ticks with respect the axis line.
Size of the major tick lines to draw.
Width of the major tick lines to be drawn.
Size of the minor tick lines to draw.
Width of the minor tick lines to be drawn.
Number of minor ticks between each major tick.
Draw ticks along axis.
Draw ticks along all radial axis lines.
Draw ticks along the upper border of the axes grid.
Draw ticks along the lower border of the axes grid.
Distance between major ticks.
Value to place the first major tick mark.
- RadialTicks.auto_spacing
Automatically set the spacing between tick marks.
Example usage:
>>> axis.ticks.auto_spacing = True
- Type:
- RadialTicks.direction
How to draw the ticks with respect the axis line.
Possible values:
TickDirection.In,TickDirection.OutorTickDirection.Centered:>>> from tecplot.constant import TickDirection >>> axis.ticks.direction = TickDirection.Centered
- Type:
- RadialTicks.length
Size of the major tick lines to draw.
Example usage:
>>> axis.ticks.length = 2
- Type:
float(percent of frame height)
- RadialTicks.line_thickness
Width of the major tick lines to be drawn.
Example usage:
>>> axis.ticks.line_thickness = 0.4
- Type:
- RadialTicks.minor_length
Size of the minor tick lines to draw.
Example usage:
>>> axis.ticks.minor_length = 1.2
- Type:
float(percent of frame height)
- RadialTicks.minor_line_thickness
Width of the minor tick lines to be drawn.
Example usage:
>>> axis.ticks.minor_line_thickness = 0.1
- Type:
- RadialTicks.minor_num_ticks
Number of minor ticks between each major tick.
Example usage:
>>> axis.ticks.minor_num_ticks = 3
- Type:
- RadialTicks.show_on_all_radial_axes
Draw ticks along all radial axis lines.
Example usage:
>>> plot.axes.r_axis.line.show_perpendicular = True
>>> plot.axes.r_axis.ticks.show_on_all_radial_axes = True
- Type:
- RadialTicks.show_on_border_max
Draw ticks along the upper border of the axes grid.
Example usage:
>>> axis.ticks.show_on_border_max = True
- Type:
- RadialTicks.show_on_border_min
Draw ticks along the lower border of the axes grid.
Example usage:
>>> axis.ticks.show_on_border_min = True
- Type:
TickLabels2D
- class tecplot.plot.TickLabels2D(axis)[source]
Tick labels along axes in 2D.
from datetime import datetime
import tecplot as tp
from tecplot.constant import (PlotType, AxisMode, AxisAlignment, NumberFormat,
                              Color)

# tecplot dates are in days after Midnight, Dec 30, 1899
origin = datetime(1899, 12, 30)
start = (datetime(1955, 11,  5) - origin).days
stop  = (datetime(1985, 10, 26) - origin).days

tp.new_layout()
plot = tp.active_frame().plot(tp.constant.PlotType.Sketch)
plot.activate()

plot.axes.viewport.left = 15
plot.axes.viewport.right = 95

xaxis = plot.axes.x_axis
xaxis.show = True
xaxis.min, xaxis.max = start, stop
xaxis.line.alignment = AxisAlignment.WithViewport
xaxis.line.position = 50
xaxis.ticks.auto_spacing = False
xaxis.ticks.spacing = (stop - start) // 4
xaxis.ticks.spacing_anchor = start

xaxis.tick_labels.format.format_type = NumberFormat.TimeDate
xaxis.tick_labels.format.datetime_format = 'mmm d, yyyy'
xaxis.tick_labels.color = Color.Blue
xaxis.tick_labels.angle = 45

tp.export.save_png('tick_labels_2d.png', 600, supersample=3)
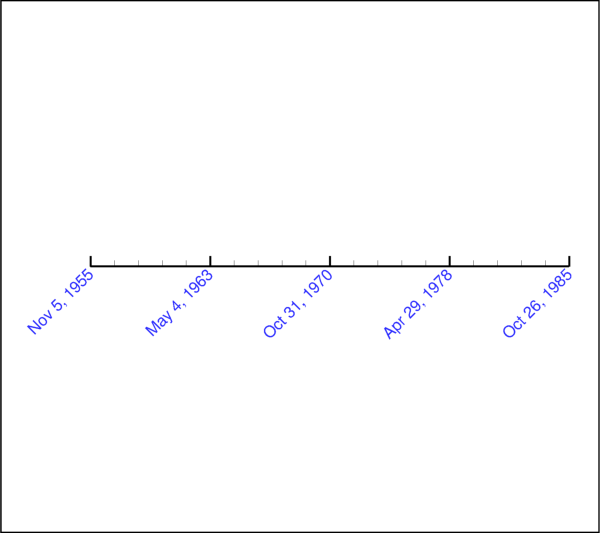
Attributes
Angle at which to render the label text.
Angle at which to render the label text.
Color of the tick labels.
Text style control including typeface and size.
Label format and style control.
Relative offset of the tick labels.
Draw labels for the major tick marks.
Include the labels at the intersection of other axes.
Draw labels along the upper grid area border.
Draw labels along the lower grid area border.
Step for labels placed on major ticks.
Make the text box around each label transparent.
- TickLabels2D.alignment
Angle at which to render the label text.
Possible values:
LabelAlignment.ByAngle,LabelAlignment.AlongAxisorLabelAlignment.PerpendicularToAxis.Example usage:
>>> from tecplot.constant import LabelAlignment
>>> axis.tick_labels.alignment = LabelAlignment.AlongAxis
- Type:
float(degrees) orLabelAlignment
- TickLabels2D.angle
Angle at which to render the label text.
The
alignmentattribute must be set toLabelAlignment.ByAngle:>>> from tecplot.constant import LabelAlignment >>> axis.tick_labels.alignment = LabelAlignment.ByAngle >>> axis.tick_labels.angle = 30
- Type:
float(degrees)
- TickLabels2D.color
Color of the tick labels.
Example usage:
>>> from tecplot.constant import Color
>>> axis.tick_labels.color = Color.Blue
- Type:
- TickLabels2D.font
Text style control including typeface and size.
Example usage:
>>> axis.tick_labels.font.typeface = 'Times'
- Type:
- TickLabels2D.format
Label format and style control.
Example usage:
>>> axis.tick_labels.format.format_type = NumberFormat.BestFloat
- Type:
- TickLabels2D.offset
Relative offset of the tick labels.
Positive values will be outside the grid area, negative values are inside the grid area:
>>> axis.tick_labels.offset = 5
- Type:
- TickLabels2D.show
Draw labels for the major tick marks.
Example usage:
>>> axis.tick_labels.show = True
- Type:
- TickLabels2D.show_at_axis_intersection
Include the labels at the intersection of other axes.
Example usage:
>>> axis.tick_labels.show_at_axis_intersection = True
- Type:
- TickLabels2D.show_on_border_max
Draw labels along the upper grid area border.
Example usage:
>>> axis.tick_labels.show_on_border_max = True
- Type:
- TickLabels2D.show_on_border_min
Draw labels along the lower grid area border.
Example usage:
>>> axis.tick_labels.show_on_border_min = True
- Type:
- TickLabels2D.step
Step for labels placed on major ticks.
A value of 1 will place a label on every major tick mark:
>>> axis.tick_labels.step = 1
- Type:
TickLabels3D
- class tecplot.plot.TickLabels3D(axis)[source]
Tick labels along axes in 3D.
from os import path
import tecplot as tp
from tecplot.constant import PlotType, Color

examples_dir = tp.session.tecplot_examples_directory()
infile = path.join(examples_dir, 'SimpleData', 'F18.plt')
dataset = tp.data.load_tecplot(infile)

frame = tp.active_frame()
plot = frame.plot(PlotType.Cartesian3D)
plot.activate()

plot.show_contour = True
plot.contour(0).legend.show = False

for ax in [plot.axes.x_axis, plot.axes.y_axis]:
    xaxis = plot.axes.x_axis
    ax.show = True
    ax.title.show = False
    ax.line.show_on_opposite_edge = True
    ax.ticks.show_on_opposite_edge = True

    ax.tick_labels.color = Color.Blue
    ax.tick_labels.show_on_opposite_edge = True
    ax.tick_labels.font.typeface = 'Times'
    ax.tick_labels.font.size = 8
    ax.tick_labels.font.italic = True

plot.view.fit()

tp.export.save_png('tick_labels_3d.png', 600, supersample=3)
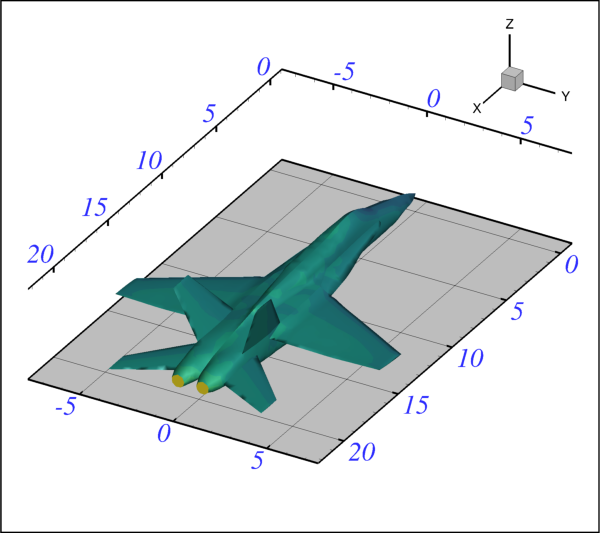
Attributes
Angle at which to render the label text.
Angle at which to render the label text.
Color of the tick labels.
Text style control including typeface and size.
Label format and style control.
Relative offset of the tick labels.
Draw labels for the major tick marks.
Draw labels on the opposite edge of the grid.
Step for labels placed on major ticks.
- TickLabels3D.alignment
Angle at which to render the label text.
Possible values:
LabelAlignment.ByAngle,LabelAlignment.AlongAxisorLabelAlignment.PerpendicularToAxis.Example usage:
>>> from tecplot.constant import LabelAlignment
>>> axis.tick_labels.alignment = LabelAlignment.AlongAxis
- Type:
float(degrees) orLabelAlignment
- TickLabels3D.angle
Angle at which to render the label text.
The
alignmentattribute must be set toLabelAlignment.ByAngle:>>> from tecplot.constant import LabelAlignment >>> axis.tick_labels.alignment = LabelAlignment.ByAngle >>> axis.tick_labels.angle = 30
- Type:
float(degrees)
- TickLabels3D.color
Color of the tick labels.
Example usage:
>>> from tecplot.constant import Color
>>> axis.tick_labels.color = Color.Blue
- Type:
- TickLabels3D.font
Text style control including typeface and size.
Example usage:
>>> axis.tick_labels.font.typeface = 'Times'
- Type:
- TickLabels3D.format
Label format and style control.
Example usage:
>>> axis.tick_labels.format.format_type = NumberFormat.BestFloat
- Type:
- TickLabels3D.offset
Relative offset of the tick labels.
Positive values will be outside the grid area, negative values are inside the grid area:
>>> axis.tick_labels.offset = 5
- Type:
- TickLabels3D.show
Draw labels for the major tick marks.
Example usage:
>>> axis.tick_labels.show = True
- Type:
- TickLabels3D.show_on_opposite_edge
Draw labels on the opposite edge of the grid.
Example usage:
>>> axis.tick_labels.show_on_opposite_edge = True
- Type:
RadialTickLabels
- class tecplot.plot.RadialTickLabels(axis)[source]
Tick mark labels along the radial axis.
from os import path
import tecplot as tp
from tecplot.constant import PlotType, ThetaMode, Color

examples_dir = tp.session.tecplot_examples_directory()
datafile = path.join(examples_dir, 'SimpleData', 'IndependentDependent.lpk')
dataset = tp.load_layout(datafile)

plot = tp.active_frame().plot(PlotType.PolarLine)
plot.activate()

plot.axes.theta_axis.mode = ThetaMode.Radians

raxis = plot.axes.r_axis
raxis.line.color = Color.Red
raxis.tick_labels.offset = -4
raxis.tick_labels.color = Color.Red
raxis.tick_labels.font.bold = True

tp.export.save_png('tick_labels_radial.png', 600, supersample=3)

Attributes
Angle at which to render the label text.
Angle at which to render the label text.
Color of the tick labels.
Text style control including typeface and size.
Label format and style control.
Relative offset of the tick labels.
Draw labels for the major tick marks.
Include the labels at the intersection of other axes.
Draw labels along all radial axis lines.
Draw labels along the upper grid area border.
Draw labels along the lower grid area border.
Step for labels placed on major ticks.
Make the text box around each label transparent.
- RadialTickLabels.alignment
Angle at which to render the label text.
Possible values:
LabelAlignment.ByAngle,LabelAlignment.AlongAxisorLabelAlignment.PerpendicularToAxis.Example usage:
>>> from tecplot.constant import LabelAlignment
>>> axis.tick_labels.alignment = LabelAlignment.AlongAxis
- Type:
float(degrees) orLabelAlignment
- RadialTickLabels.angle
Angle at which to render the label text.
The
alignmentattribute must be set toLabelAlignment.ByAngle:>>> from tecplot.constant import LabelAlignment >>> axis.tick_labels.alignment = LabelAlignment.ByAngle >>> axis.tick_labels.angle = 30
- Type:
float(degrees)
- RadialTickLabels.color
Color of the tick labels.
Example usage:
>>> from tecplot.constant import Color
>>> axis.tick_labels.color = Color.Blue
- Type:
- RadialTickLabels.font
Text style control including typeface and size.
Example usage:
>>> axis.tick_labels.font.typeface = 'Times'
- Type:
- RadialTickLabels.format
Label format and style control.
Example usage:
>>> axis.tick_labels.format.format_type = NumberFormat.BestFloat
- Type:
- RadialTickLabels.offset
Relative offset of the tick labels.
Positive values will be outside the grid area, negative values are inside the grid area:
>>> axis.tick_labels.offset = 5
- Type:
- RadialTickLabels.show
Draw labels for the major tick marks.
Example usage:
>>> axis.tick_labels.show = True
- Type:
- RadialTickLabels.show_at_axis_intersection
Include the labels at the intersection of other axes.
Example usage:
>>> axis.tick_labels.show_at_axis_intersection = True
- Type:
- RadialTickLabels.show_on_all_radial_axes
Draw labels along all radial axis lines.
Example usage:
>>> plot.axes.r_axis.line.show_perpendicular = True
>>> plot.axes.r_axis.tick_labels.show_on_all_radial_axes = True
- Type:
- RadialTickLabels.show_on_border_max
Draw labels along the upper grid area border.
Example usage:
>>> axis.tick_labels.show_on_border_max = True
- Type:
- RadialTickLabels.show_on_border_min
Draw labels along the lower grid area border.
Example usage:
>>> axis.tick_labels.show_on_border_min = True
- Type:
- RadialTickLabels.step
Step for labels placed on major ticks.
A value of 1 will place a label on every major tick mark:
>>> axis.tick_labels.step = 1
- Type:
Axis Title
Axis2DTitle
- class tecplot.plot.Axis2DTitle(axis)[source]
Sketch plot axis label string, font and style control.
import tecplot as tp
from tecplot.constant import PlotType, Color

plot = tp.active_frame().plot(PlotType.Sketch)

viewport = plot.axes.viewport
viewport.left = 10
viewport.right = 90
viewport.bottom = 10

xaxis = plot.axes.x_axis
xaxis.show = True
xaxis.title.text = 'distance (m)'
xaxis.title.color = Color.DarkTurquoise
xaxis.title.offset = -7

tp.export.save_png('axis_title_sketch.png', 600, supersample=3)
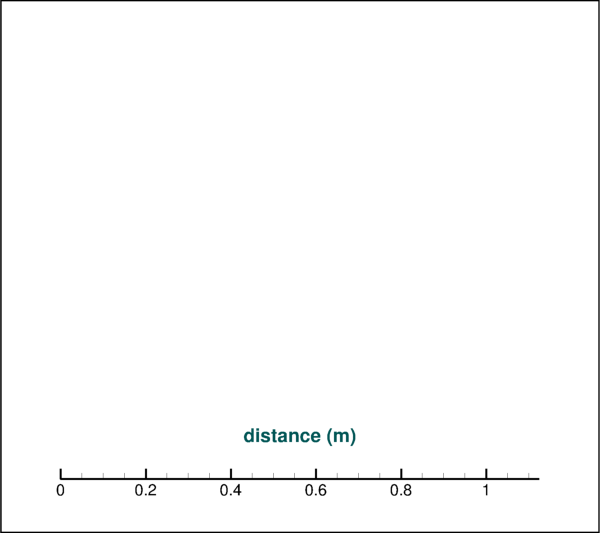
Attributes
Text color of axis title.
Typeface and size of the text.
Transverse offset of the title from the axis.
Percent along axis line to place title.
Place title along the axis.
Draw title along the upper grid area border.
Draw title along the lower grid area border.
The text of the title for this axis.
- Axis2DTitle.color
Text color of axis title.
Example usage:
>>> from tecplot.constant import Color
>>> axis.title.color = Color.Blue
- Type:
- Axis2DTitle.font
Typeface and size of the text.
Example usage:
>>> axis.title.font.size = 5
- Type:
- Axis2DTitle.offset
Transverse offset of the title from the axis.
Positive values are outside the axes, negative numbers are inside the axes. Example usage:
>>> axis.title.offset = 5
- Type:
floatin percent of frame height.
- Axis2DTitle.position
Percent along axis line to place title.
Example usage:
>>> axis.title.position = 50
- Type:
- Axis2DTitle.show_on_border_max
Draw title along the upper grid area border.
Example usage:
>>> axis.title.show_on_border_max = True
- Type:
- Axis2DTitle.show_on_border_min
Draw title along the lower grid area border.
Example usage:
>>> axis.title.show_on_border_min = True
- Type:
DataAxis2DTitle
- class tecplot.plot.DataAxis2DTitle(axis)[source]
Axis label string, font and style control for 2D data plots.
from os import path
import tecplot as tp
from tecplot.constant import PlotType, SurfacesToPlot, Color, AxisTitleMode

examples_dir = tp.session.tecplot_examples_directory()
infile = path.join(examples_dir, 'SimpleData', 'F18.plt')
dataset = tp.data.load_tecplot(infile)

plot = tp.active_frame().plot(PlotType.Cartesian2D)
plot.activate()

plot.show_contour = True
plot.contour(0).variable = dataset.variable('S')
plot.contour(0).colormap_name = 'Sequential - Yellow/Green/Blue'
plot.contour(0).legend.show = False

plot.fieldmap(0).surfaces.surfaces_to_plot = SurfacesToPlot.BoundaryFaces

xaxis = plot.axes.x_axis
xaxis.title.title_mode = AxisTitleMode.UseText
xaxis.title.text = 'Longitudinal (m)'
xaxis.title.color = Color.Blue

# place the x-axis title at the x-coordinate 10.0
xaxis.title.position = 100 * (10.0 - xaxis.min) / (xaxis.max - xaxis.min)

yaxis = plot.axes.y_axis
yaxis.title.title_mode = AxisTitleMode.UseText
yaxis.title.text = 'Transverse (m)'
yaxis.title.color = Color.Blue

# place the y-axis title at the y-coordinate 0.0
yaxis.title.position = 100 * (0.0 - yaxis.min) / (yaxis.max - yaxis.min)

tp.export.save_png('axis_title_2d.png', 600, supersample=3)

Attributes
Text color of axis title.
Typeface and size of the text.
Transverse offset of the title from the axis.
Percent along axis line to place title.
Place title along the axis.
Draw title along the upper grid area border.
Draw title along the lower grid area border.
The text of the title for this axis.
Define the source for the axis title.
- DataAxis2DTitle.color
Text color of axis title.
Example usage:
>>> from tecplot.constant import Color
>>> axis.title.color = Color.Blue
- Type:
- DataAxis2DTitle.font
Typeface and size of the text.
Example usage:
>>> axis.title.font.size = 5
- Type:
- DataAxis2DTitle.offset
Transverse offset of the title from the axis.
Positive values are outside the axes, negative numbers are inside the axes. Example usage:
>>> axis.title.offset = 5
- Type:
floatin percent of frame height.
- DataAxis2DTitle.position
Percent along axis line to place title.
Example usage:
>>> axis.title.position = 50
- Type:
- DataAxis2DTitle.show
Place title along the axis.
Example usage:
>>> axis.title.show = False
- Type:
- DataAxis2DTitle.show_on_border_max
Draw title along the upper grid area border.
Example usage:
>>> axis.title.show_on_border_max = True
- Type:
- DataAxis2DTitle.show_on_border_min
Draw title along the lower grid area border.
Example usage:
>>> axis.title.show_on_border_min = True
- Type:
- DataAxis2DTitle.text
The text of the title for this axis.
The
title_modeattribute must be set toAxisTitleMode.UseText:>>> from tecplot.constant import AxisTitleMode >>> axis.title.title_mode = AxisTitleMode.UseText >>> axis.title.text = 'distance (m)'
- Type:
- DataAxis2DTitle.title_mode
Define the source for the axis title.
Possible values:
AxisTitleMode.UseTextorAxisTitleMode.UseVarName.Example usage:
>>> from tecplot.constant import AxisTitleMode
>>> axis.title.title_mode = AxisTitleMode.UseVarName
- Type:
DataAxis3DTitle
- class tecplot.plot.DataAxis3DTitle(axis)[source]
Axis label string, font and style control for 3D plots.
from os import path
import tecplot as tp
from tecplot.constant import PlotType, SurfacesToPlot, Color, AxisTitleMode

examples_dir = tp.session.tecplot_examples_directory()
infile = path.join(examples_dir, 'SimpleData', 'F18.plt')
dataset = tp.data.load_tecplot(infile)

plot = tp.active_frame().plot(PlotType.Cartesian3D)
plot.activate()

plot.show_contour = True
plot.contour(0).variable = dataset.variable('S')
plot.contour(0).colormap_name = 'Sequential - Yellow/Green/Blue'
plot.contour(0).legend.show = False

plot.fieldmap(0).surfaces.surfaces_to_plot = SurfacesToPlot.BoundaryFaces

xaxis = plot.axes.x_axis
xaxis.show = True
xaxis.title.title_mode = AxisTitleMode.UseText
xaxis.title.text = 'Longitudinal (m)'
xaxis.title.color = Color.BluePurple
xaxis.title.position = 10

yaxis = plot.axes.y_axis
yaxis.show = True
yaxis.title.title_mode = AxisTitleMode.UseText
yaxis.title.text = 'Transverse (m)'
yaxis.title.color = Color.BluePurple
yaxis.title.position = 90

zaxis = plot.axes.z_axis
zaxis.show = True
zaxis.title.title_mode = AxisTitleMode.UseText
zaxis.title.text = 'Height (m)'
zaxis.title.color = Color.BluePurple
zaxis.title.offset = 13

plot.view.fit()

tp.export.save_png('axis_title_3d.png', 600, supersample=3)
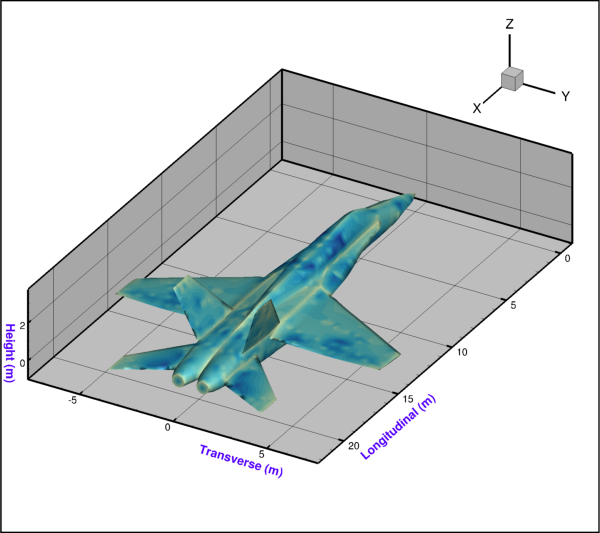
Attributes
Text color of axis title.
Typeface and size of the text.
Transverse offset of the title from the axis.
Percent along axis line to place title.
Place title along the axis.
Draw the title on the opposite edge of the grid.
The text of the title for this axis.
Define the source for the axis title.
- DataAxis3DTitle.color
Text color of axis title.
Example usage:
>>> from tecplot.constant import Color
>>> axis.title.color = Color.Blue
- Type:
- DataAxis3DTitle.font
Typeface and size of the text.
Example usage:
>>> axis.title.font.size = 5
- Type:
- DataAxis3DTitle.offset
Transverse offset of the title from the axis.
Positive values are outside the axes, negative numbers are inside the axes. Example usage:
>>> axis.title.offset = 5
- Type:
floatin percent of frame height.
- DataAxis3DTitle.position
Percent along axis line to place title.
Example usage:
>>> axis.title.position = 50
- Type:
- DataAxis3DTitle.show
Place title along the axis.
Example usage:
>>> axis.title.show = False
- Type:
- DataAxis3DTitle.show_on_opposite_edge
Draw the title on the opposite edge of the grid.
Example usage:
>>> axis.title.show_on_opposite_edge = True
- Type:
- DataAxis3DTitle.text
The text of the title for this axis.
The
title_modeattribute must be set toAxisTitleMode.UseText:>>> from tecplot.constant import AxisTitleMode >>> axis.title.title_mode = AxisTitleMode.UseText >>> axis.title.text = 'distance (m)'
- Type:
- DataAxis3DTitle.title_mode
Define the source for the axis title.
Possible values:
AxisTitleMode.UseTextorAxisTitleMode.UseVarName.Example usage:
>>> from tecplot.constant import AxisTitleMode
>>> axis.title.title_mode = AxisTitleMode.UseVarName
- Type:
RadialAxisTitle
- class tecplot.plot.RadialAxisTitle(axis)[source]
Radial axis label string, font and style control for polar plots.
import numpy as np
import tecplot as tp
from tecplot.constant import PlotType, Color, AxisTitleMode

npoints = 300
r = np.linspace(0, 2000, npoints)
theta = np.linspace(0, 1000, npoints)

frame = tp.active_frame()
dataset = frame.create_dataset('Data', ['R', 'Theta'])
zone = dataset.add_ordered_zone('Zone', (300,))
zone.values('R')[:] = r
zone.values('Theta')[:] = theta

plot = frame.plot(PlotType.PolarLine)
plot.activate()

plot.axes.r_axis.max = np.max(r)

plot.delete_linemaps()
lmap = plot.add_linemap('Linemap', zone, dataset.variable('R'),
                        dataset.variable('Theta'))
lmap.line.line_thickness = 0.8

raxis = plot.axes.r_axis
raxis.line.show_both_directions = True
raxis.line.show_perpendicular = True

raxis.title.title_mode = AxisTitleMode.UseText
raxis.title.text = 'Radial Position (cm)'
raxis.title.show_on_all_radial_axes = True
raxis.title.color = Color.Blue
raxis.title.position = 80

plot.view.fit()

tp.export.save_png('axis_title_radial.png', 600, supersample=3)
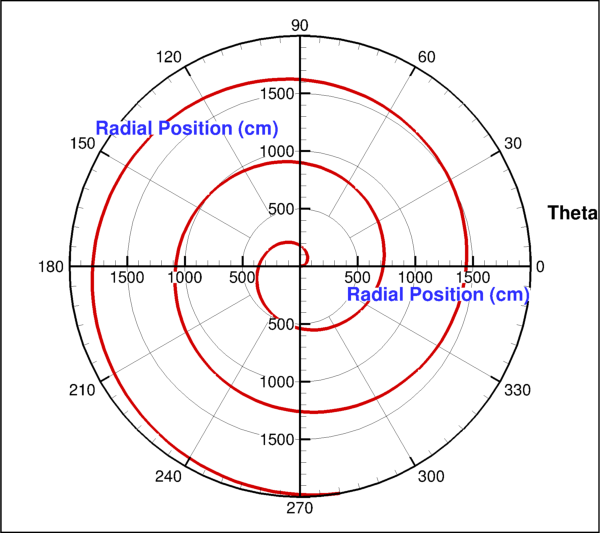
Attributes
Text color of axis title.
Typeface and size of the text.
Transverse offset of the title from the axis.
Percent along axis line to place title.
Place title along the axis.
Draw title along all radial axis lines.
Draw title along the upper grid area border.
Draw title along the lower grid area border.
The text of the title for this axis.
Define the source for the axis title.
- RadialAxisTitle.color
Text color of axis title.
Example usage:
>>> from tecplot.constant import Color
>>> axis.title.color = Color.Blue
- Type:
- RadialAxisTitle.font
Typeface and size of the text.
Example usage:
>>> axis.title.font.size = 5
- Type:
- RadialAxisTitle.offset
Transverse offset of the title from the axis.
Positive values are outside the axes, negative numbers are inside the axes. Example usage:
>>> axis.title.offset = 5
- Type:
floatin percent of frame height.
- RadialAxisTitle.position
Percent along axis line to place title.
Example usage:
>>> axis.title.position = 50
- Type:
- RadialAxisTitle.show
Place title along the axis.
Example usage:
>>> axis.title.show = False
- Type:
- RadialAxisTitle.show_on_all_radial_axes
Draw title along all radial axis lines.
Example usage:
>>> plot.axes.r_axis.line.show_perpendicular = True
>>> plot.axes.r_axis.title.show_on_all_radial_axes = True
- Type:
- RadialAxisTitle.show_on_border_max
Draw title along the upper grid area border.
Example usage:
>>> axis.title.show_on_border_max = True
- Type:
- RadialAxisTitle.show_on_border_min
Draw title along the lower grid area border.
Example usage:
>>> axis.title.show_on_border_min = True
- Type:
- RadialAxisTitle.text
The text of the title for this axis.
The
title_modeattribute must be set toAxisTitleMode.UseText:>>> from tecplot.constant import AxisTitleMode >>> axis.title.title_mode = AxisTitleMode.UseText >>> axis.title.text = 'distance (m)'
- Type:
- RadialAxisTitle.title_mode
Define the source for the axis title.
Possible values:
AxisTitleMode.UseTextorAxisTitleMode.UseVarName.Example usage:
>>> from tecplot.constant import AxisTitleMode
>>> axis.title.title_mode = AxisTitleMode.UseVarName
- Type:
Grid Area
GridArea
- class tecplot.plot.GridArea(axes)[source]
Grid area for polar 2D plots.
from os import path
import tecplot as tp
from tecplot.constant import PlotType, ThetaMode, Color

examples_dir = tp.session.tecplot_examples_directory()
datafile = path.join(examples_dir, 'SimpleData', 'IndependentDependent.lpk')
dataset = tp.load_layout(datafile)

plot = tp.active_frame().plot(PlotType.PolarLine)
plot.activate()

plot.axes.theta_axis.mode = ThetaMode.Radians
plot.axes.grid_area.fill_color = Color.Creme

grid_area = plot.axes.grid_area
grid_area.filled = True
grid_area.fill_color = Color.SkyBlue
grid_area.show_border = True

tp.export.save_png('grid_area_polar.png', 600, supersample=3)
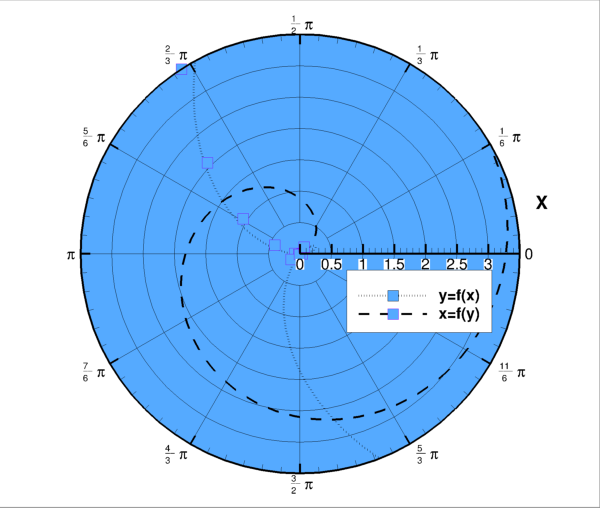
Attributes
Axes area background color.
Fill the axes area background color.
Draw border around axes area.
- GridArea.fill_color
Axes area background color.
This requires the
filledattribute to beTrue:>>> from tecplot.constant import Color >>> plot.axes.grid_area.filled = True >>> plot.axes.grid_area.fill_color = Color.LightGreen
- Type:
- GridArea.filled
Fill the axes area background color.
Example usage:
>>> from tecplot.constant import Color
>>> plot.axes.grid_area.filled = True
>>> plot.axes.grid_area.fill_color = Color.LightGreen
- Type:
Cartesian2DGridArea
- class tecplot.plot.Cartesian2DGridArea(axes)[source]
Grid area for cartesian 2D plots.
from os import path import tecplot as tp from tecplot.constant import PlotType, Color examples_dir = tp.session.tecplot_examples_directory() infile = path.join(examples_dir, 'SimpleData', 'SunSpots.plt') dataset = tp.data.load_tecplot(infile) frame = tp.active_frame() plot = frame.plot(PlotType.XYLine) plot.linemap(0).line.color = Color.DarkBlue plot.linemap(0).line.line_thickness = 1.0 grid_area = plot.axes.grid_area grid_area.filled = True grid_area.fill_color = Color.SkyBlue grid_area.show_border = True tp.export.save_png('grid_area_2d.png', 600, supersample=3)
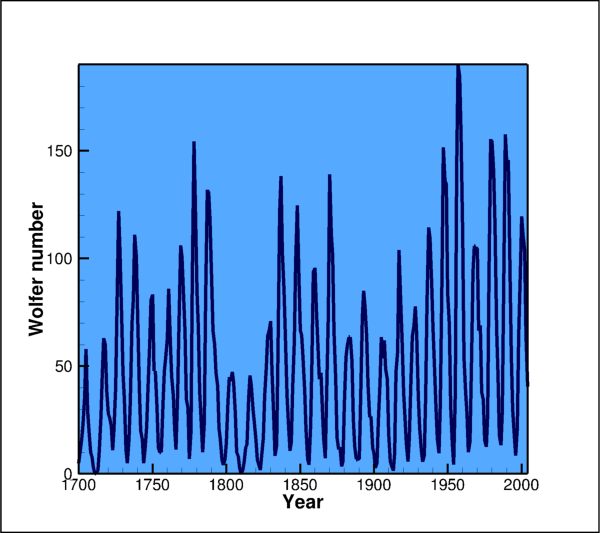
Attributes
Border line color.
Width of the border lines to be drawn.
Axes area background color.
Fill the axes area background color.
Draw border around axes area.
- Cartesian2DGridArea.border_color
Border line color.
Example usage:
>>> from tecplot.constant import Color >>> plot.axes.grid_area.show_border = True >>> plot.axes.grid_area.border_color = Color.LightGreen
- Type:
- Cartesian2DGridArea.border_thickness
Width of the border lines to be drawn.
Example usage:
>>> plot.axes.grid_area.border_thickness = 0.5
- Type:
- Cartesian2DGridArea.fill_color
Axes area background color.
This requires the
filledattribute to beTrue:>>> from tecplot.constant import Color >>> plot.axes.grid_area.filled = True >>> plot.axes.grid_area.fill_color = Color.LightGreen
- Type:
- Cartesian2DGridArea.filled
Fill the axes area background color.
Example usage:
>>> from tecplot.constant import Color
>>> plot.axes.grid_area.filled = True
>>> plot.axes.grid_area.fill_color = Color.LightGreen
- Type:
Cartesian3DGridArea
- class tecplot.plot.Cartesian3DGridArea(axes)[source]
Grid area for 3D field plots.
from os import path import tecplot as tp from tecplot.constant import PlotType, SurfacesToPlot, Color examples_dir = tp.session.tecplot_examples_directory() infile = path.join(examples_dir, 'SimpleData', 'Pyramid.plt') dataset = tp.data.load_tecplot(infile) frame = tp.active_frame() plot = frame.plot(PlotType.Cartesian3D) fmaps = plot.fieldmaps() fmaps.contour.show = True fmaps.surfaces.surfaces_to_plot = SurfacesToPlot.BoundaryFaces plot.show_contour = True plot.contour(0).legend.show = False for axis in plot.axes: axis.show = True grid_area = plot.axes.grid_area grid_area.fill_color = Color.SkyBlue grid_area.show_border = True grid_area.use_lighting_effect = True plot.view.fit() tp.export.save_png('grid_area_3d.png', 600, supersample=3)
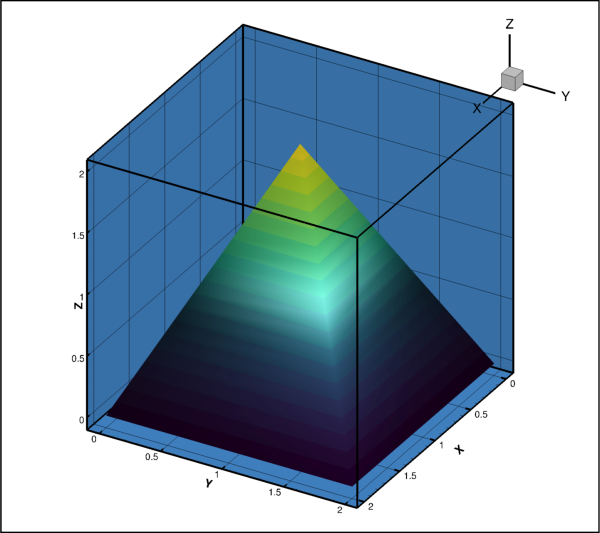
Attributes
Axes area background color.
Fill the axes area background color.
Draw border around axes area.
Enable lighting effect shading on grid area.
- Cartesian3DGridArea.fill_color
Axes area background color.
This requires the
filledattribute to beTrue:>>> from tecplot.constant import Color >>> plot.axes.grid_area.filled = True >>> plot.axes.grid_area.fill_color = Color.LightGreen
- Type:
- Cartesian3DGridArea.filled
Fill the axes area background color.
Example usage:
>>> from tecplot.constant import Color
>>> plot.axes.grid_area.filled = True
>>> plot.axes.grid_area.fill_color = Color.LightGreen
- Type:
- Cartesian3DGridArea.show_border
Draw border around axes area.
Example usage:
>>> plot.axes.grid_area.show_border = True
- Type:
PreciseGrid
- class tecplot.plot.PreciseGrid(axes)[source]
Grid of precise dots aligned with all tick marks.
from os import path
import tecplot as tp
from tecplot.constant import PlotType, LinePattern, Color

examples_dir = tp.session.tecplot_examples_directory()
datafile = path.join(examples_dir, 'SimpleData', 'RainierElevation.plt')
dataset = tp.data.load_tecplot(datafile)

plot = tp.active_frame().plot(PlotType.Cartesian2D)
plot.activate()

plot.show_contour = True
plot.contour(0).colormap_name = 'Elevation - Above Ground Level'

xaxis = plot.axes.x_axis
plot.axes.preserve_scale = True
xaxis.max = xaxis.variable.values(0).max()

grid = plot.axes.precise_grid
grid.show = True
grid.size = 0.05

# ensure consistent output between interactive (connected) and batch
plot.contour(0).levels.reset_to_nice()

tp.export.save_png('precise_grid.png', 600, supersample=3)
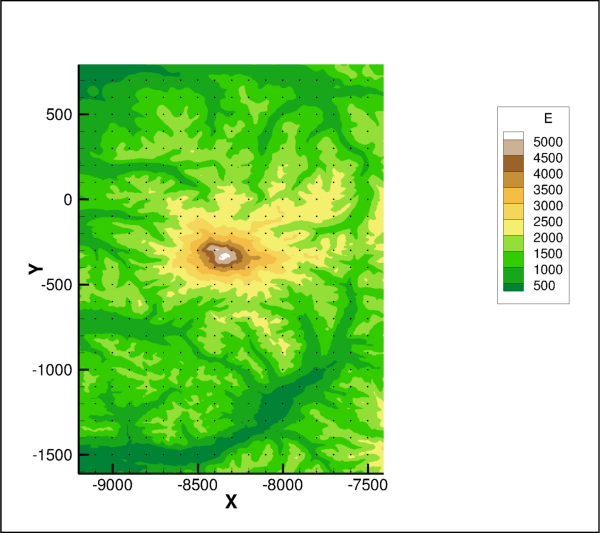
Attributes
Color of the dots for precise grid.
Draw precise grid dots in axes area.
Size of the dots for precise grid.
- PreciseGrid.color
Color of the dots for precise grid.
Example usage:
>>> plot.axes.precise_grid.color = Color.DarkBlue
- Type:
- PreciseGrid.show
Draw precise grid dots in axes area.
Example usage:
>>> plot.axes.precise_grid.show = True
- Type:
GridLines
- class tecplot.plot.GridLines(axis)[source]
Major grid lines.
from os import path
import tecplot as tp
from tecplot.constant import LinePattern, Color

examples_dir = tp.session.tecplot_examples_directory()
datafile = path.join(examples_dir, 'SimpleData', 'Sphere.lpk')
dataset = tp.load_layout(datafile)

plot = tp.active_frame().plot()

plot.axes.grid_area.fill_color = Color.Grey

for axis in (plot.axes.x_axis, plot.axes.y_axis):
    axis.show = True
    grid_lines = axis.grid_lines
    grid_lines.show = True
    grid_lines.line_pattern = LinePattern.LongDash
    grid_lines.color = Color.Cyan

plot.view.fit()

tp.export.save_png('grid_lines.png', 600, supersample=3)

Attributes
Colorof the grid lines to be drawn.Pattern style of the grid lines to be drawn.
Width of the grid lines to be drawn.
Segment length of the repeated line pattern.
Draw grid lines as tick locations.
- GridLines.color
Colorof the grid lines to be drawn.Example usage:
>>> from tecplot.constant import Color
>>> grid_lines.color = Color.Blue
- Type:
- GridLines.line_pattern
Pattern style of the grid lines to be drawn.
Possible values:
Solid,Dashed,DashDot,Dotted,LongDash,DashDotDot.Example usage:
>>> from tecplot.constant import LinePattern
>>> grid_lines.line_pattern = LinePattern.LongDash
- Type:
- GridLines.line_thickness
Width of the grid lines to be drawn.
Example usage:
>>> grid_lines.line_thickness = 0.5
- Type:
- GridLines.pattern_length
Segment length of the repeated line pattern.
Example usage:
>>> from tecplot.constant import LinePattern >>> grid_lines.line_pattern = LinePattern.LongDash >>> grid_lines.pattern_length = 3.5
- Type:
GridLines2D
- class tecplot.plot.GridLines2D(axis)[source]
Major grid lines following the primary tick mark locations.
The lines drawn are determined by the placement of major tick marks along the axis:
from os import path import tecplot as tp from tecplot.constant import LinePattern, Color examples_dir = tp.session.tecplot_examples_directory() datafile = path.join(examples_dir, 'SimpleData', 'IndependentDependent.lpk') dataset = tp.load_layout(datafile) for axis in tp.active_frame().plot().axes: grid_lines = axis.grid_lines grid_lines.show = True grid_lines.line_pattern = LinePattern.LongDash grid_lines.color = Color.Green tp.export.save_png('grid_lines_2d.png', 600, supersample=3)

Attributes
Colorof the grid lines to be drawn.Draw grid behind all other plot elements.
Pattern style of the grid lines to be drawn.
Width of the grid lines to be drawn.
Segment length of the repeated line pattern.
Draw grid lines as tick locations.
- GridLines2D.color
Colorof the grid lines to be drawn.Example usage:
>>> from tecplot.constant import Color >>> grid_lines.color = Color.Blue
- Type:
- GridLines2D.draw_last
Draw grid behind all other plot elements.
Example usage:
>>> axis.grid_lines.draw_last = True
- Type:
- GridLines2D.line_pattern
Pattern style of the grid lines to be drawn.
Possible values:
Solid,Dashed,DashDot,Dotted,LongDash,DashDotDot.Example usage:
>>> from tecplot.constant import LinePattern >>> grid_lines.line_pattern = LinePattern.LongDash
- Type:
- GridLines2D.line_thickness
Width of the grid lines to be drawn.
Example usage:
>>> grid_lines.line_thickness = 0.5
- Type:
- GridLines2D.pattern_length
Segment length of the repeated line pattern.
Example usage:
>>> from tecplot.constant import LinePattern >>> grid_lines.line_pattern = LinePattern.LongDash >>> grid_lines.pattern_length = 3.5
- Type:
MinorGridLines
- class tecplot.plot.MinorGridLines(axis)[source]
Minor grid lines.
from os import path import tecplot as tp from tecplot.constant import LinePattern, Color examples_dir = tp.session.tecplot_examples_directory() datafile = path.join(examples_dir, 'SimpleData', 'Sphere.lpk') dataset = tp.load_layout(datafile) plot = tp.active_frame().plot() plot.axes.grid_area.fill_color = Color.Grey for axis in (plot.axes.x_axis, plot.axes.y_axis): axis.show = True grid_lines = axis.grid_lines grid_lines.show = True minor_grid_lines = axis.minor_grid_lines minor_grid_lines.show = True minor_grid_lines.line_pattern = LinePattern.Dotted minor_grid_lines.color = Color.Cyan plot.view.fit() tp.export.save_png('minor_grid_lines.png', 600, supersample=3)
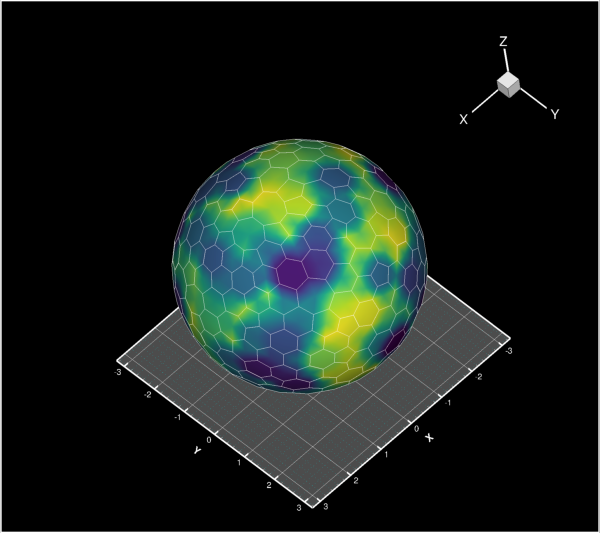
Attributes
Colorof the grid lines to be drawn.Pattern style of the grid lines to be drawn.
Width of the grid lines to be drawn.
Segment length of the repeated line pattern.
Draw grid lines as tick locations.
- MinorGridLines.color
Colorof the grid lines to be drawn.Example usage:
>>> from tecplot.constant import Color >>> grid_lines.color = Color.Blue
- Type:
- MinorGridLines.line_pattern
Pattern style of the grid lines to be drawn.
Possible values:
Solid,Dashed,DashDot,Dotted,LongDash,DashDotDot.Example usage:
>>> from tecplot.constant import LinePattern >>> grid_lines.line_pattern = LinePattern.LongDash
- Type:
- MinorGridLines.line_thickness
Width of the grid lines to be drawn.
Example usage:
>>> grid_lines.line_thickness = 0.5
- Type:
- MinorGridLines.pattern_length
Segment length of the repeated line pattern.
Example usage:
>>> from tecplot.constant import LinePattern >>> grid_lines.line_pattern = LinePattern.LongDash >>> grid_lines.pattern_length = 3.5
- Type:
MinorGridLines2D
- class tecplot.plot.MinorGridLines2D(axis)[source]
Minor grid lines following the secondary tick mark locations.
The lines drawn are determined by the placement of minor tick marks along the axis. Example usage:
from os import path import tecplot as tp from tecplot.constant import LinePattern, Color examples_dir = tp.session.tecplot_examples_directory() datafile = path.join(examples_dir, 'SimpleData', 'IndependentDependent.lpk') dataset = tp.load_layout(datafile) for axis in tp.active_frame().plot().axes: grid_lines = axis.grid_lines grid_lines.show = True minor_grid_lines = axis.minor_grid_lines minor_grid_lines.show = True minor_grid_lines.line_pattern = LinePattern.Dotted minor_grid_lines.color = Color.Green tp.export.save_png('minor_grid_lines_2d.png', 600, supersample=3)
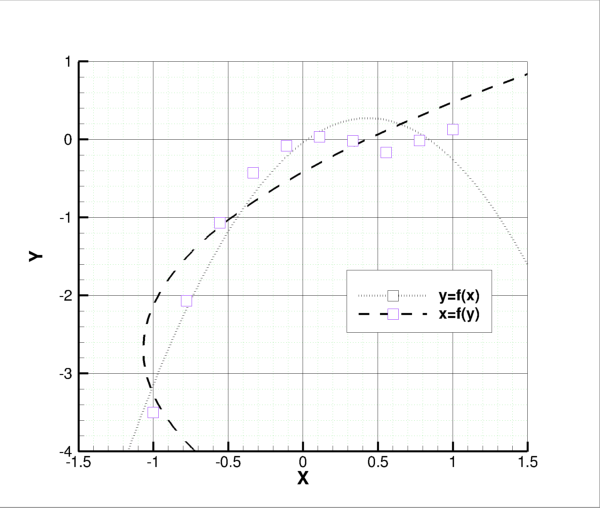
Attributes
Colorof the grid lines to be drawn.Draw grid behind all other plot elements.
Pattern style of the grid lines to be drawn.
Width of the grid lines to be drawn.
Segment length of the repeated line pattern.
Draw grid lines as tick locations.
- MinorGridLines2D.color
Colorof the grid lines to be drawn.Example usage:
>>> from tecplot.constant import Color >>> grid_lines.color = Color.Blue
- Type:
- MinorGridLines2D.draw_last
Draw grid behind all other plot elements.
Example usage:
>>> axis.grid_lines.draw_last = True
- Type:
- MinorGridLines2D.line_pattern
Pattern style of the grid lines to be drawn.
Possible values:
Solid,Dashed,DashDot,Dotted,LongDash,DashDotDot.Example usage:
>>> from tecplot.constant import LinePattern >>> grid_lines.line_pattern = LinePattern.LongDash
- Type:
- MinorGridLines2D.line_thickness
Width of the grid lines to be drawn.
Example usage:
>>> grid_lines.line_thickness = 0.5
- Type:
- MinorGridLines2D.pattern_length
Segment length of the repeated line pattern.
Example usage:
>>> from tecplot.constant import LinePattern >>> grid_lines.line_pattern = LinePattern.LongDash >>> grid_lines.pattern_length = 3.5
- Type:
PolarAngleGridLines
- class tecplot.plot.PolarAngleGridLines(axis)[source]
Major grid lines along the theta axis.
The lines drawn are determined by the placement of minor tick marks along the axis. Example usage:
from os import path import tecplot as tp from tecplot.constant import PlotType, ThetaMode, LinePattern, Color examples_dir = tp.session.tecplot_examples_directory() datafile = path.join(examples_dir, 'SimpleData', 'IndependentDependent.lpk') dataset = tp.load_layout(datafile) plot = tp.active_frame().plot(PlotType.PolarLine) plot.activate() plot.axes.theta_axis.mode = ThetaMode.Radians plot.axes.grid_area.filled = True plot.axes.grid_area.fill_color = Color.Creme for axis in plot.axes: grid_lines = axis.grid_lines grid_lines.show = True grid_lines.line_pattern = LinePattern.LongDash grid_lines.color = Color.Green for lmap in plot.linemaps(): lmap.show_in_legend = False lmap.line.line_pattern = LinePattern.Solid lmap.line.line_thickness = 0.8 tp.export.save_png('grid_lines_polar.png', 600, supersample=3)
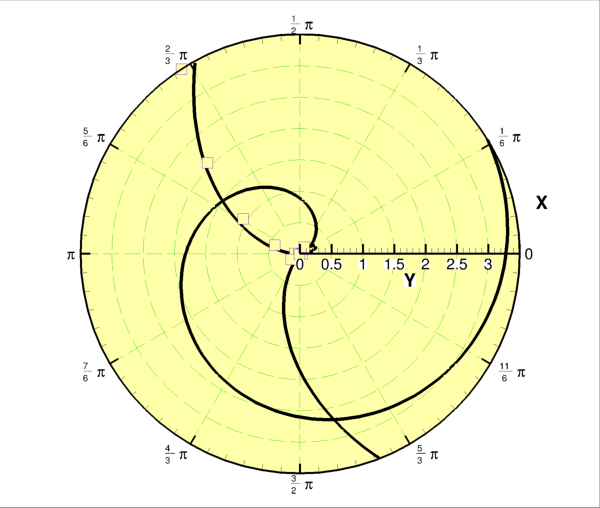
Attributes
Colorof the grid lines to be drawn.Draw grid behind all other plot elements.
Pattern style of the grid lines to be drawn.
Width of the grid lines to be drawn.
Segment length of the repeated line pattern.
Minimum radial position of theta grid lines.
Draw grid lines as tick locations.
- PolarAngleGridLines.color
Colorof the grid lines to be drawn.Example usage:
>>> from tecplot.constant import Color >>> grid_lines.color = Color.Blue
- Type:
- PolarAngleGridLines.draw_last
Draw grid behind all other plot elements.
Example usage:
>>> axis.grid_lines.draw_last = True
- Type:
- PolarAngleGridLines.line_pattern
Pattern style of the grid lines to be drawn.
Possible values:
Solid,Dashed,DashDot,Dotted,LongDash,DashDotDot.Example usage:
>>> from tecplot.constant import LinePattern >>> grid_lines.line_pattern = LinePattern.LongDash
- Type:
- PolarAngleGridLines.line_thickness
Width of the grid lines to be drawn.
Example usage:
>>> grid_lines.line_thickness = 0.5
- Type:
- PolarAngleGridLines.pattern_length
Segment length of the repeated line pattern.
Example usage:
>>> from tecplot.constant import LinePattern >>> grid_lines.line_pattern = LinePattern.LongDash >>> grid_lines.pattern_length = 3.5
- Type:
PolarAngleMinorGridLines
- class tecplot.plot.PolarAngleMinorGridLines(axis)[source]
Minor grid lines along the theta axis.
The lines drawn are determined by the placement of minor tick marks along the axis. Example usage:
from os import path import tecplot as tp from tecplot.constant import PlotType, ThetaMode, LinePattern, Color examples_dir = tp.session.tecplot_examples_directory() datafile = path.join(examples_dir, 'SimpleData', 'IndependentDependent.lpk') dataset = tp.load_layout(datafile) plot = tp.active_frame().plot(PlotType.PolarLine) plot.activate() plot.axes.theta_axis.mode = ThetaMode.Radians plot.axes.grid_area.filled = True plot.axes.grid_area.fill_color = Color.Creme for axis in plot.axes: grid_lines = axis.grid_lines grid_lines.show = True minor_grid_lines = axis.minor_grid_lines minor_grid_lines.show = True minor_grid_lines.line_pattern = LinePattern.Dotted minor_grid_lines.color = Color.Green for lmap in plot.linemaps(): lmap.show_in_legend = False lmap.line.line_pattern = LinePattern.Solid lmap.line.line_thickness = 0.8 tp.export.save_png('minor_grid_lines_polar.png', 600, supersample=3)
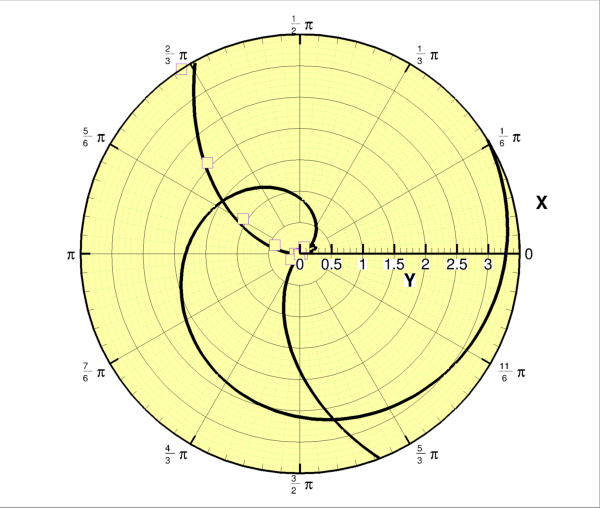
Attributes
Colorof the grid lines to be drawn.Draw grid behind all other plot elements.
Pattern style of the grid lines to be drawn.
Width of the grid lines to be drawn.
Segment length of the repeated line pattern.
Minimum radial position of theta grid lines.
Draw grid lines as tick locations.
- PolarAngleMinorGridLines.color
Colorof the grid lines to be drawn.Example usage:
>>> from tecplot.constant import Color >>> grid_lines.color = Color.Blue
- Type:
- PolarAngleMinorGridLines.draw_last
Draw grid behind all other plot elements.
Example usage:
>>> axis.grid_lines.draw_last = True
- Type:
- PolarAngleMinorGridLines.line_pattern
Pattern style of the grid lines to be drawn.
Possible values:
Solid,Dashed,DashDot,Dotted,LongDash,DashDotDot.Example usage:
>>> from tecplot.constant import LinePattern >>> grid_lines.line_pattern = LinePattern.LongDash
- Type:
- PolarAngleMinorGridLines.line_thickness
Width of the grid lines to be drawn.
Example usage:
>>> grid_lines.line_thickness = 0.5
- Type:
- PolarAngleMinorGridLines.pattern_length
Segment length of the repeated line pattern.
Example usage:
>>> from tecplot.constant import LinePattern >>> grid_lines.line_pattern = LinePattern.LongDash >>> grid_lines.pattern_length = 3.5
- Type:
MarkerGridLine
- class tecplot.plot.MarkerGridLine(axis)[source]
Marker line to indicate a particular position along an axis.
from os import path import tecplot as tp from tecplot.constant import PlotType, Color, PositionMarkerBy examples_dir = tp.session.tecplot_examples_directory() datafile = path.join(examples_dir, 'SimpleData', 'Sphere.lpk') dataset = tp.load_layout(datafile) plot = tp.active_frame().plot(PlotType.Cartesian3D) plot.activate() plot.axes.grid_area.fill_color = Color.Grey plot.axes.x_axis.show = True plot.axes.y_axis.show = True marker = plot.axes.x_axis.marker_grid_line marker.show = True marker.position_by = PositionMarkerBy.Constant marker.position = 1.5 marker.color = Color.Cyan marker = plot.axes.y_axis.marker_grid_line marker.show = True marker.position_by = PositionMarkerBy.Constant marker.position = 0.5 marker.color = Color.Yellow plot.view.fit() tp.export.save_png('marker_grid_line.png', 600, supersample=3)

Attributes
Colorof the grid lines to be drawn.Pattern style of the grid lines to be drawn.
Width of the grid lines to be drawn.
Segment length of the repeated line pattern.
Position of the marker line in axes coordinates.
Position of the marker line in axes coordinates.
Draw grid lines as tick locations.
- MarkerGridLine.color
Colorof the grid lines to be drawn.Example usage:
>>> from tecplot.constant import Color >>> grid_lines.color = Color.Blue
- Type:
- MarkerGridLine.line_pattern
Pattern style of the grid lines to be drawn.
Possible values:
Solid,Dashed,DashDot,Dotted,LongDash,DashDotDot.Example usage:
>>> from tecplot.constant import LinePattern >>> grid_lines.line_pattern = LinePattern.LongDash
- Type:
- MarkerGridLine.line_thickness
Width of the grid lines to be drawn.
Example usage:
>>> grid_lines.line_thickness = 0.5
- Type:
- MarkerGridLine.pattern_length
Segment length of the repeated line pattern.
Example usage:
>>> from tecplot.constant import LinePattern >>> grid_lines.line_pattern = LinePattern.LongDash >>> grid_lines.pattern_length = 3.5
- Type:
- MarkerGridLine.position
Position of the marker line in axes coordinates.
The
position_byattribute must be set toPositionMarkerBy.Constant:>>> from tecplot.constant import PositionMarkerBy >>> marker_line = plot.axes.x_axis.marker_grid_line >>> marker_line.position_by = PositionMarkerBy.Constant >>> marker_line.position = 3.14
- Type:
- MarkerGridLine.position_by
Position of the marker line in axes coordinates.
- Possible values:
PositionMarkerBy.Constantor
The position can be set to a constant or to the solution time of the linked frame:
>>> from tecplot.constant import PositionMarkerBy >>> marker_line = plot.axes.x_axis.marker_grid_line >>> marker_line.position_by = PositionMarkerBy.SolutionTime
- Type:
- Possible values:
MarkerGridLine2D
- class tecplot.plot.MarkerGridLine2D(axis)[source]
Marker line to indicate a particular position along an axis.
from os import path import tecplot as tp from tecplot.constant import PlotType, Color, PositionMarkerBy examples_dir = tp.session.tecplot_examples_directory() datafile = path.join(examples_dir, 'SimpleData', 'IndependentDependent.lpk') dataset = tp.load_layout(datafile) plot = tp.active_frame().plot(PlotType.XYLine) plot.activate() marker = plot.axes.x_axis(0).marker_grid_line marker.show = True marker.position_by = PositionMarkerBy.Constant marker.position = -0.4 marker.color = Color.Blue marker = plot.axes.y_axis(0).marker_grid_line marker.show = True marker.position_by = PositionMarkerBy.Constant marker.position = -0.88 marker.color = Color.Blue tp.export.save_png('marker_grid_line_2d.png', 600, supersample=3)

Attributes
Colorof the grid lines to be drawn.Draw grid behind all other plot elements.
Pattern style of the grid lines to be drawn.
Width of the grid lines to be drawn.
Segment length of the repeated line pattern.
Position of the marker line in axes coordinates.
Position of the marker line in axes coordinates.
Draw grid lines as tick locations.
- MarkerGridLine2D.color
Colorof the grid lines to be drawn.Example usage:
>>> from tecplot.constant import Color >>> grid_lines.color = Color.Blue
- Type:
- MarkerGridLine2D.draw_last
Draw grid behind all other plot elements.
Example usage:
>>> axis.grid_lines.draw_last = True
- Type:
- MarkerGridLine2D.line_pattern
Pattern style of the grid lines to be drawn.
Possible values:
Solid,Dashed,DashDot,Dotted,LongDash,DashDotDot.Example usage:
>>> from tecplot.constant import LinePattern >>> grid_lines.line_pattern = LinePattern.LongDash
- Type:
- MarkerGridLine2D.line_thickness
Width of the grid lines to be drawn.
Example usage:
>>> grid_lines.line_thickness = 0.5
- Type:
- MarkerGridLine2D.pattern_length
Segment length of the repeated line pattern.
Example usage:
>>> from tecplot.constant import LinePattern >>> grid_lines.line_pattern = LinePattern.LongDash >>> grid_lines.pattern_length = 3.5
- Type:
- MarkerGridLine2D.position
Position of the marker line in axes coordinates.
The
position_byattribute must be set toPositionMarkerBy.Constant:>>> from tecplot.constant import PositionMarkerBy >>> marker_line = plot.axes.x_axis.marker_grid_line >>> marker_line.position_by = PositionMarkerBy.Constant >>> marker_line.position = 3.14
- Type:
- MarkerGridLine2D.position_by
Position of the marker line in axes coordinates.
- Possible values:
PositionMarkerBy.Constantor
The position can be set to a constant or to the solution time of the linked frame:
>>> from tecplot.constant import PositionMarkerBy >>> marker_line = plot.axes.x_axis.marker_grid_line >>> marker_line.position_by = PositionMarkerBy.SolutionTime
- Type:
- Possible values:
PolarAngleMarkerGridLine
- class tecplot.plot.PolarAngleMarkerGridLine(axis)[source]
The marker grid line for the theta axis.
Attributes
Colorof the grid lines to be drawn.Draw grid behind all other plot elements.
Pattern style of the grid lines to be drawn.
Width of the grid lines to be drawn.
Segment length of the repeated line pattern.
Position of the marker line in axes coordinates.
Position of the marker line in axes coordinates.
Minimum radial position of theta grid lines.
Draw grid lines as tick locations.
- PolarAngleMarkerGridLine.color
Colorof the grid lines to be drawn.Example usage:
>>> from tecplot.constant import Color >>> grid_lines.color = Color.Blue
- Type:
- PolarAngleMarkerGridLine.draw_last
Draw grid behind all other plot elements.
Example usage:
>>> axis.grid_lines.draw_last = True
- Type:
- PolarAngleMarkerGridLine.line_pattern
Pattern style of the grid lines to be drawn.
Possible values:
Solid,Dashed,DashDot,Dotted,LongDash,DashDotDot.Example usage:
>>> from tecplot.constant import LinePattern >>> grid_lines.line_pattern = LinePattern.LongDash
- Type:
- PolarAngleMarkerGridLine.line_thickness
Width of the grid lines to be drawn.
Example usage:
>>> grid_lines.line_thickness = 0.5
- Type:
- PolarAngleMarkerGridLine.pattern_length
Segment length of the repeated line pattern.
Example usage:
>>> from tecplot.constant import LinePattern >>> grid_lines.line_pattern = LinePattern.LongDash >>> grid_lines.pattern_length = 3.5
- Type:
- PolarAngleMarkerGridLine.position
Position of the marker line in axes coordinates.
The
position_byattribute must be set toPositionMarkerBy.Constant:>>> from tecplot.constant import PositionMarkerBy >>> marker_line = plot.axes.x_axis.marker_grid_line >>> marker_line.position_by = PositionMarkerBy.Constant >>> marker_line.position = 3.14
- Type:
- PolarAngleMarkerGridLine.position_by
Position of the marker line in axes coordinates.
- Possible values:
PositionMarkerBy.Constantor
The position can be set to a constant or to the solution time of the linked frame:
>>> from tecplot.constant import PositionMarkerBy >>> marker_line = plot.axes.x_axis.marker_grid_line >>> marker_line.position_by = PositionMarkerBy.SolutionTime
- Type:
- Possible values:
OrientationAxis
- class tecplot.plot.OrientationAxis(axes)[source]
The orientation axis for 3D Field plots.
This is the small (x, y, z) reference axis object which can moved, resized and modified using this class.
By default, all 3D plots show the 3D orientation axis in the upper right of the frame. It can be repositioned by setting
positionas shown below:from os import path import tecplot as tp from tecplot.constant import Color examples_dir = tp.session.tecplot_examples_directory() infile = path.join(examples_dir, 'SimpleData', 'Sphere.lpk') dataset = tp.load_layout(infile) frame = tp.active_frame() plot = frame.plot() plot.axes.orientation_axis.position = 15, 15 plot.axes.orientation_axis.color = Color.BrightCyan plot.axes.reset_range() plot.view.fit() tp.export.save_png('axes_orientation.png', 600, supersample=3)
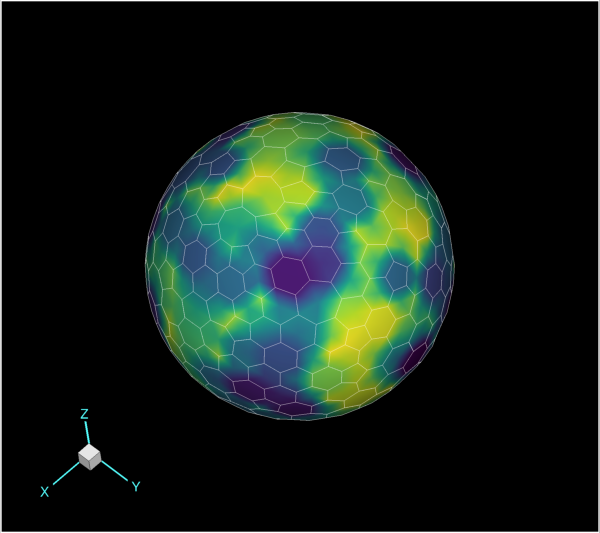
Attributes
Colorof the orientation axes.Line thickness used when drawing the orientation axis as a percentage of frame height.
(x, y)position of the orientation axis.Enable drawing of the orientation axis.
Use variable names instead of 'X', 'Y' and 'Z'.
Size of the orientation axis as a percentage of frame size (0-100).
- OrientationAxis.color
Colorof the orientation axes.Example usage:
>>> from tecplot.constant import Color >>> plot.axes.orientation_axis.color = Color.Cyan
- Type:
- OrientationAxis.line_thickness
Line thickness used when drawing the orientation axis as a percentage of frame height.
Example usage:
>>> plot.axes.orientation_axis.line_thickness = 0.8
- Type:
- OrientationAxis.position
(x, y)position of the orientation axis.The position is in percent from the lower-left corner of the viewport:
>>> plot.axes.orientation_axis.position = (15, 15)
- Type:
- OrientationAxis.show
Enable drawing of the orientation axis.
Example usage:
>>> plot.axes.orientation_axis.show = False
- Type:
- OrientationAxis.show_variable_name
Use variable names instead of ‘X’, ‘Y’ and ‘Z’.
Example usage:
>>> plot.axes.orientation_axis.show_variable_name = True
- Type:
