Tecplot 360 EX offers a variety of curve-fits and spline fits. By specifying the curve type, you control how the data points are connected in a line (see “Line Map Layer” on page 144).
The first two columns, Map Number and Map Name, list the mapping number and the mapping name. The Map Show field lists which mappings are currently active. These columns behave the same as the corresponding columns on the Definitions page (see “Mapping Definitions” on page 139).
Set the type of curve plotted for a mapping by right-clicking the desired Curve Type entry on the Curves page of the Mapping Style dialog.
Tecplot 360 EX offers the following curve types:
• Line Segment (No Curve-fit) - A series of linear segments connect adjacent data points. In XY Line plots, these will be line segments.
• Linear Fit: A linear function is fit to the data points. In XY Line plots, this will be a straight line.
• Polynomial Curve-fit - A polynomial of order N is fit to the data points (where 1 <= N <= 10, for N=1 a Linear Fit is done).
• Exponential Curve-fit - An exponential curve-fit that finds the best curve of the form Y=eb*ln X + c(equivalent to Y=a*eb*X, where a = ec). To use this curve type, Y-values for this variable must be all positive or all negative. If the function dependency is set to X=f(Y) all X-values must be all positive or all negative.
• Power Curve-fit - A power curve fit that finds the best curve of the form Y=eb * ln X + c (equivalent to Y=a*Xb, where a = ec). To use this curve type, Y-values for this variable must be all positive or all negative; X-values must be all positive. If the function dependency is set to X=f(Y), X-values must be all positive or all negative, and the Y-values must all be positive.
• Spline - A smooth curve is generated that goes through every point. The spline is drawn through the data points after sorting the points into increasing values of the independent variable, resulting in a single-valued function of the independent variable. The spline may be clamped or free. With a clamped spline, you supply the derivative of the function at each end point; with a non-clamped (natural or free) spline, these derivatives are determined for you. In XY Line plots, specifying the derivative gives you control over the initial and final slopes of the curve.
• Parametric Spline - Creates a smooth curve as with a spline, except the assumption is that both variables are functions of the index of the data points. (For example in XY Line plot, ParaSpline fits x=f(i) and y=g(i) where f() and g() are both smooth.) No additional sorting of the points is performed; the sorting specified on the Definitions page of the Zone Style dialog is used for the order of the data points. This spline may result in a multi-valued function (of either or both axis variables).
• Extended Curve-fit - Uses a curve-fit supplied by an add-on. These curve-fits may be provided by Tecplot 360 EX, a third party, or written by users. The functionality of each extended curve-fit is defined by its creator.
Linear Fit, Polynomial Fit, Exponential Fit, and Power Fit are all determined by using a least squares algorithm. Examples of each curve-fit type are shown in Figure 6-5.
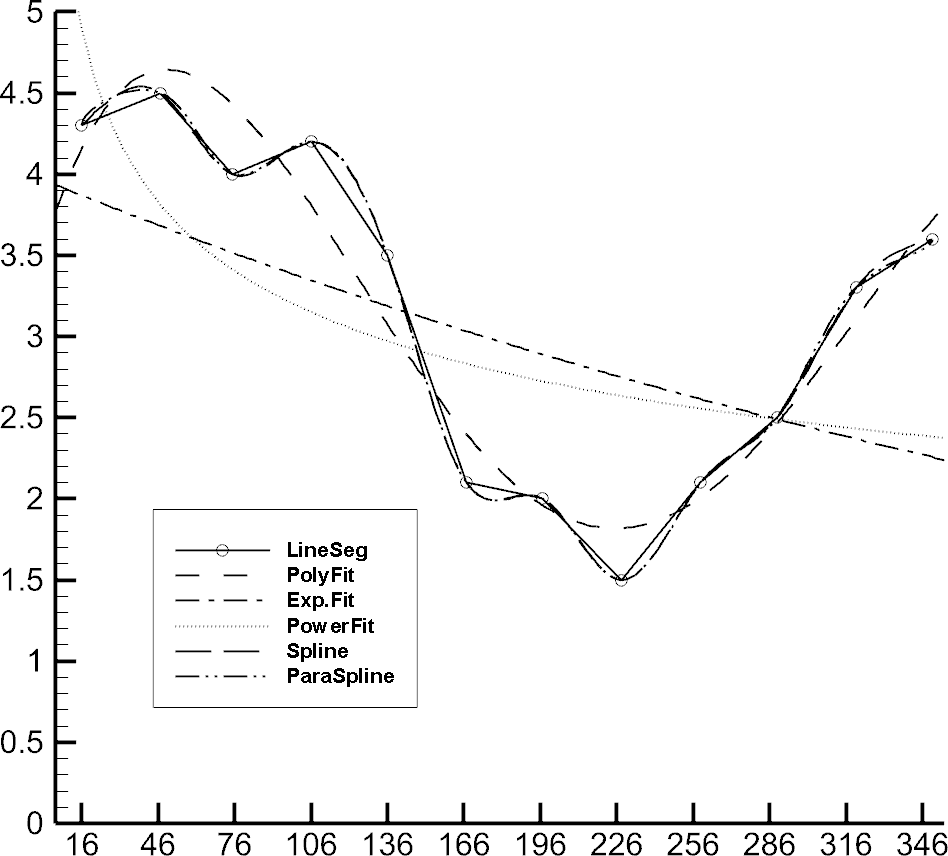
Figure 6-5. Tecplot 360 EX's curve-fit types.
The Curves page also contains fields for controlling the following attributes:
• Dependent Variable - Right-click to choose how curve fits and splines are interpreted. Dependent Variable has no effect on mappings of the Line Segment curve type.
• Curve Points - Controls the number of points used to draw curve fits and splines. Right-click to choose a preset number of points or to enter your own. Raising the number of points increases the accuracy of the curve but also increases plotting time and the size of print files.
• Curve Setting - Displays options specific to the curve type, such as weighting for curve fits or starting derivatives for splines. Right-click to set these options.
|
|
 For information on using the controls at the bottom of the Mapping Style dialog to select mappings by name, see the description of these at the end of