Existing mappings are edited with the Plot menu's Mapping Style dialog. From the Definitions page of the Mapping Style dialog, you can modify names, activate and deactivate mappings, assign axis variables, assign zones, sort data points in a mapping, control the mappings appearance in the line plot legend, and assign particular X and Y-axes to XY-line plots.
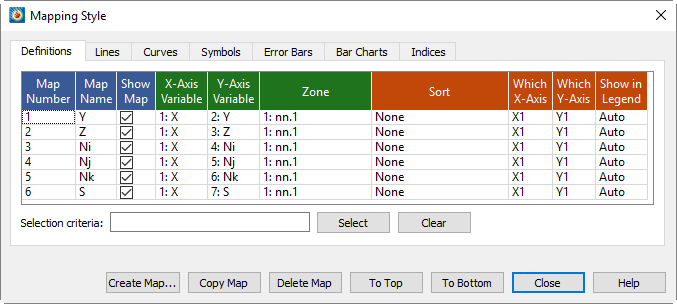
Some settings are represented by checkboxes, which can be toggled on and off by clicking them. Other settings require a right-click. In general, select the mapping or mappings you want to change, then right-click the selection in the column of the setting to be edited. Most of the time this will activate a pop-up menu; in other cases, a dialog appears. You may change mappings whether they are shown on the plot or not (activated or deactivated).
• Map Number - Displays the number of each map. This cannot be edited.
• Map Name - Double-click the map name to edit it. Type Enter to complete the edit or Escape to cancel without saving the edit.
• Show Map - Each mapping can be opted in and out of a plot by toggling the checkbox or by right-clicking and choosing one of the following options:
• Activate - Turns selected mappings on.
• Deactivate - Turns selected mappings off.
• Show Selected Only - Turns on selected mappings, and turns off all other mappings.
• Invert - Switches the current activation settings for the selected map(s).
• Axis Variables - The choice of variables is the heart of the mapping. Each mapping is defined by two variables: X and Y in XY Line plots and Theta and R in Polar Line plots. You may change the variables assigned to a mapping by right-clicking or double-clicking.
• 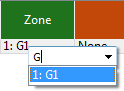 Zone - Each mapping uses variable values from a specified zone. If your dataset has multiple zones, specify the zone for each mapping by right-clicking or double-clicking the displayed zone name.
The pop-up field chooser appears. Display a list of all zones by clicking the downward-pointing arrow next to the filter field, or start typing to display a filtered list of the zones whose name contains what you type.
• Sort - By default, mappings are sorted by the order in which they occur in the data file. You can change this order with the Sort option on the Definitions page of the Mapping Style dialog.
Choose from one of the following Sort options:
• None - Default behavior of sorting by the order in the data file.
• By Independent Variable - Points are sorted in ascending order of the values of the independent variable.
• By Dependent Variable - Points are sorted in ascending order of the values of the dependent variable.
• By Specific Variable - Select a variable from the Select Variable dialog. The points of the selected mappings are sorted in ascending order of the values of this variable.
|
|
 Only Line Segment and Parametric Spline curve types are affected by the Sort options. Splines are always sorted by the independent variable. See
 • Which Axes - XY Line plots support five X-axes (X1-X5) and five Y-axes (Y1-Y5). Newly created mapping use the X1 and Y1-axes. You can change these assignments by right-clicking.
The ranges and scales for each axis are defined in the Axis Details dialog (accessed via the Plot >Axis).
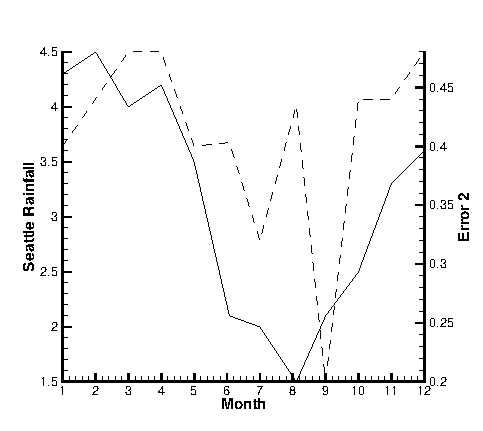
Figure 6-4. An XY Line plot using two Y-axes.
By default, the X1 axis is placed at the bottom of your axis grid area, and subsequent X axes at the top. Similarly, it places axis Y1 at the left of your axis grid area and subsequent Y-axes at the right. Thus, in Figure 6-4, the Seattle rainfall observations are shown along axis Y1 at the left of the axis grid area, while the error observations are shown along Y2 at the right.
You can also use multiple axes to cycle through mappings with different ranges or axis settings. You may find it convenient to assign different mappings to different axes so that you can set axis ranges, axis positions, or other axis attributes independently for each mapping.
• Show in Legend - By default, all active mappings appear in the line legend. However, the legend only lists mappings with identical entries once. (See Section 6 - 7 “Line Legend” for details on the Line Plot Legend.) The [Show in Legend] button has three options:
• Always - The mapping appears in the legend even if the mapping is turned off (deactivated) or its entry in the table looks exactly like another mapping's entry.
• Never - The mapping never appears in the legend.
• Auto - The mapping appears in the legend only when the mapping is turned on. If two mappings would result in the same entry in the legend, only one entry is shown.
• Selection Criteria - Enter a wildcard pattern and click Select to select one or more mappings based their name. In wildcard patterns, most characters match themselves, but the * and ? characters have special meaning.
|
Character |
Meaning |
|---|---|
|
? |
Matches any single character. |
|
* |
Matches any number of characters, including none. |
• Clear - Clear the selection and the pattern field.