Tecplot 360 EX fits the data to a linear function using the standard least-squares algorithm. It calculates the function for which the sum of the squared differences from the data points is a minimum. For the XY Line plot type, the linear function is a straight line.
To fit a linear function to your data, right-click in the Curve Type column on the Curves page of the Mapping Style dialog and select "Linear Fit." Then right-click in the Curve Setting column and choose Settings to display the Curve Fit Settings dialog, shown below.
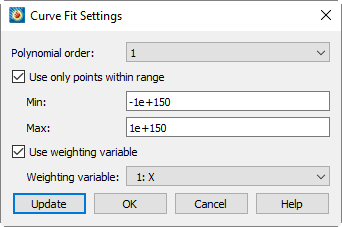
• Polynomial Order is shown on the dialog, but should always be "1" for a linear fit. If you change this from 1, the curve type is changed to Polynomial Curve-fit.
• To limit the points used in the mapping(s): select "Use Only Points Within Range", and enter minimum and maximum values.
• To assign a curve weighting variable: select "Use Weighting Variable", and select the variable from the drop-down. For more information on curve weighting, see Curve-fit Weighting Variables.