The cubic spline fit assumes that the spline function is a single-valued function of the independent variable.
Sometimes, however, you have data that curves back upon itself, but you would still like to have a spline-like curve fit to it. Parametric splines solve this problem by presuming that both variables (X&Y or Theta&R) are functions of the data-point index. The spline is then defined by two single-valued functions of the data-point index.
Unlike cubic splines, parametric splines are plotted in the order set in the Sort option of the Definitions page of the Mapping Style dialog. By default, the points are unsorted, and thus the spline is drawn in the order the data points appear in the data file. See Section 6 - 1.1 “Mapping Definitions” for a discussion of sorting.
To fit a paraspline function to your data, right-click in the Curve Type column on the Curves page of the Mapping Style dialog and choose "ParaSpline."
By default, This option fits two natural cubic splines to the data point index.
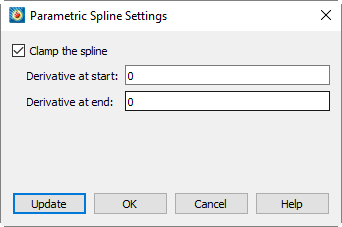
To specify a clamped spline:
1.Select Para Spline from the Curve drop-down menu, and then select Curve Settings.
2.In the Parametric Spline Settings dialog (shown below), select "Clamp the Spline", and enter values for the derivative at the start and end of the spline.
For the XY Line plot type, the derivatives are either dy/dx or dx/dy depending on the Function Dependency for the mapping. Tecplot 360 EX calculates dx/ds and dy/ds from these values (where s is the parametric variable). For the Polar Line plot type, the derivatives are either dR/dTheta or dTheta/dR (depending on the Function Dependency for the mapping), and dR/ds and dTheta/ds are calculated from these values (where s is the parametric variable). See Dependent and Independent Variables for a full description of the Function Dependency option.