Tecplot 360 EX fits a power function to data using the standard least-squares algorithm. The dependent-variable values must be either all positive or all negative, and the independent values should be all positive. Data points with zero or negative independent values are ignored.
For XY plots (where X is the independent variable): Tecplot 360 EX finds best curve of the form:
Y=eb*lnX+c (equivalent to Y=a*Xb where a=ec).
Similarly, when Y is the independent variable.
For Polar plots (where Theta is the independent variable): Tecplot 360 EX finds the best curve of the form:
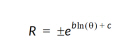 or
or 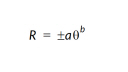
Similarly, when R is the independent variable.
To fit a power-curve function to your data, right-click in the Curve Type column on the Curves page of the Mapping Style dialog and select "Power Curve."
This option uses all the data points in the mapping, weighting them equally.
Use the Power Fit Settings dialog (accessed via the [Curve Settings] button) to specify different settings. The dialog is shown below.
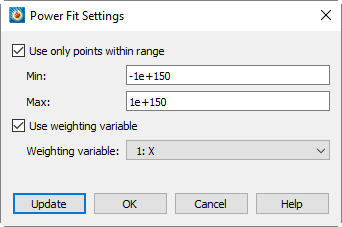
• To limit the points used in the mapping(s) - Select "Use Only Points Within Range", and enter minimum and maximum values.
• To assign a curve weighting variable - Select "Use Weighting Variable", and select the variable from the drop-down. For more information on curve weighting, see Curve-fit Weighting Variables.