Introduction
Tecplot Chorus provides a robust framework for managing CFD projects, such as parametric studies, that require multiple simulation cases with tools to evaluate the results. You can evaluate overall system performance and visually compare tens or thousands of simulation cases in a single environment, helping you make decisions faster and with more confidence than ever before.

Tecplot Chorus’s flexible data management system and sophisticated analysis and collaboration tools work equally well with a handful of cases or thousands, letting you quickly discover trends and anomalies even in large studies and giving you deeper insight than ever before into the underlying physical phenomena.
With Tecplot Chorus, you can:
-
Gather metadata, data, and images from the names of the folders in your solver output or from generated CSV (comma-separated value) files, and append new data whenever additional cases are available or when variables or auxiliary files are added.
-
View your cases in a variety of layouts, or even in more than one layout at a time, and filter cases to quickly locate the ones you’re interested in. Use the plot views to help communicate your results to others.
-
Compare images and data files from multiple cases and highlight the differences among them.
-
Perform "deep dives" using the full power of Tecplot 360 to inspect, visualize, and analyze the raw data for one or more cases.
-
Generate new images or data files for some or all cases from the raw data.
-
Create a surrogate model to fill in the gaps between your cases, helping you to better visualize your results. Data from the surrogate model can be exported.
| Tecplot Chorus never modifies your data. Any information you create is stored in the Tecplot Chorus project, or in folders separate from your original files. |
Tecplot Chorus Fundamentals
Tecplot Chorus organizes your results into projects. (See Projects.) A project typically corresponds to a single parametric CFD study you have performed; this is not, however, a requirement. There might also be situations in which you would want to create more than one Tecplot Chorus project from a single CFD study or to create one project combining multiple studies.
A Tecplot Chorus project contains not the complete data from each CFD case, but the independent variables (parameters) given to the solver, and the dependent variables (outputs) generated by the solver. Additionally, the project contains links to images and data files associated with each case, if any.
Projects are stored in a file with a name ending in .chprj. This file may be located on a network for easy access by members of a team; however, only one user can use the project at a time.
The input parameters and result variables for each case (often referred to as metadata) are imported to a project either by reading a CSV file or by extracting values from the names of the folders in which the cases are stored—or both techniques may be used. If you run additional cases, Tecplot Chorus can update the project with just the data from the new cases.
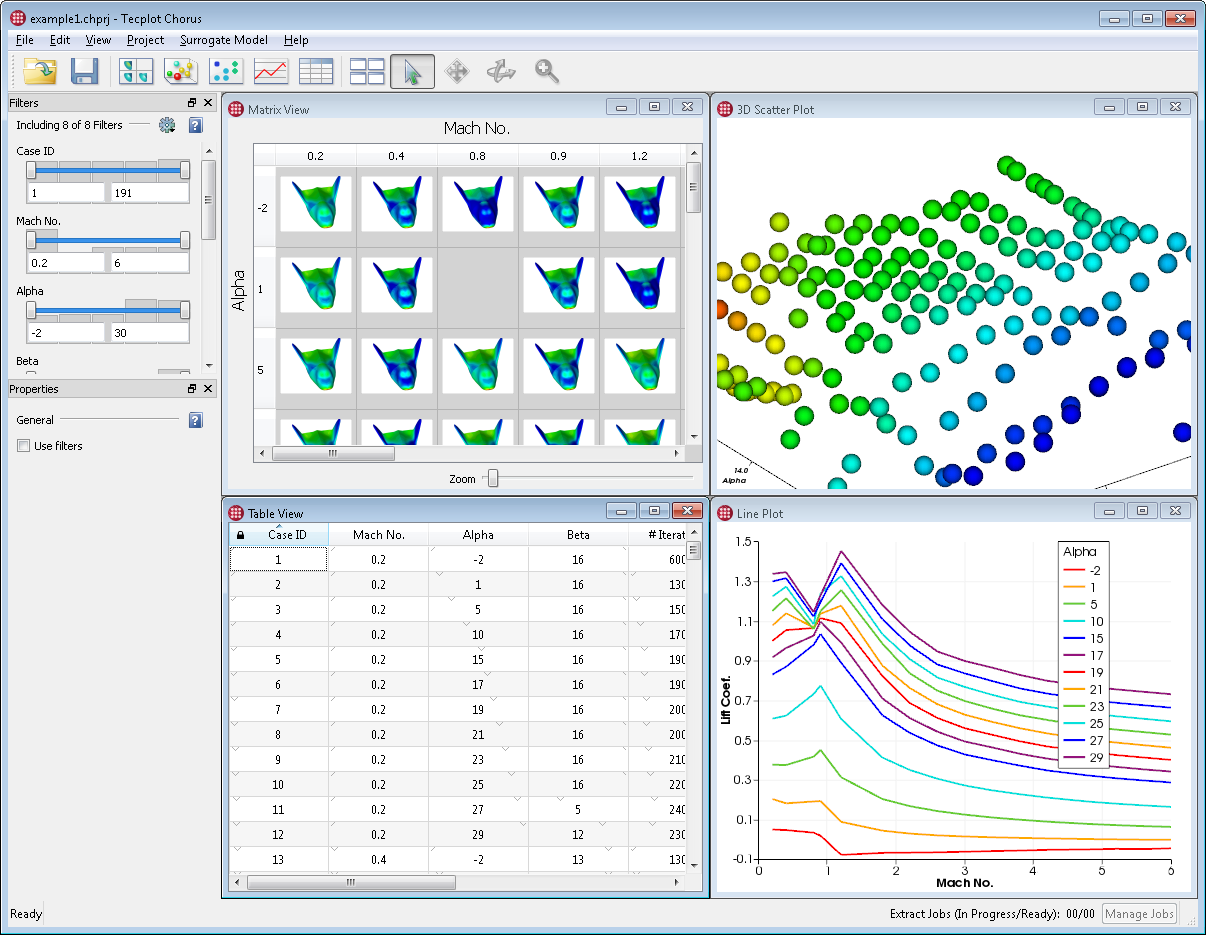
Once you have created a project and imported metadata from your study into it, you can view the results of your study in a number of ways (see Exploring Your Results).
- Table
-
A spreadsheet-like table showing you the values of independent and dependent variables for all cases.
- Matrix
-
A grid view that shows you an image of each case for combinations of two or three variables. (If you don’t have such images, Tecplot Chorus can make them for you as a batch operation, applying any desired visual style.)
- Plots
-
Various graphical representations of the relationships between dependent and independent variables in your study, including a line/symbol plot, a 2D scatter plot, and a 3D scatter plot.
These views are readily filterable, so you can easily home in on the cases you’re interested in. You can select one or more cases and view any images associated with them, or see the differences between cases based on their images, and do a "deep dive" into the solution’s full data set by opening it in Tecplot 360. (See Analyzing Individual Cases)
Tecplot Chorus can also generate a surrogate model that helps fill in the gaps between your cases to help you detect trends and anomalies (see Surrogate Models). Data from this model may be exported and used to help predict, refine, or sanity-check future cases in the study.
Organizing Your Study
Tecplot Chorus works best when all of the image and data files related to a study are organized into folders inside a single hierarchy, with all of the files related to a single case in the same folder. Tecplot Chorus will import your data in one of the following ways:
-
By reading variable values and auxiliary file names from a comma-separated value (CSV) file. It may be possible to configure your solver to generate such a file, or you may use additional software or scripts to generate the CSV file during a post-processing step.
Each row in a CSV file should contain input and output variable values for one case. Columns containing solely numeric data are taken to be variables. (The text "NaN," meaning "Not a Number," is also accepted in otherwise numeric columns to indicate an invalid or missing value.) Additional text columns may specify paths to associated image and data files or may be used for metadata such as dates, names, and notes.
If you are using only CSV files to import data into Tecplot Chorus, it is not strictly necessary that all your image and data files be in a single folder hierarchy as long as the CSV file contains the complete path of such files starting from the filesystem root (Linux) or a drive or network location (Windows). However, we recommend using paths relative to a project root folder so that you can easily move the project elsewhere if desired.
Even if you use absolute paths, you will still need to designate a "root folder" for your project to tell Tecplot Chorus where to store any files it generates.
-
By reading variable values from folder or file names and by finding image and data files based on their names. For this to work, your solver must be able to deposit results using folder or file names based on the names and values of each case’s input variables. For example, the result data file for a given case might be in a hierarchy of folders such that its complete path looks like this:
…/Mach_0.1/Alpha_10/Beta_15/result.dat
It is also acceptable if your solver creates folders at a single level rather than in a hierarchy, as long as the paths contain the required independent variable names and values, such as:
…/Mach0.1_Alpha10_Beta15/result.dat
Tecplot Chorus can extract the values of the parameters Mach, Alpha, and Beta from either style of folder structure for each case in your study, and relate each data and image file to a specific case based on the parameter values from the file path.
-
Using some combination of CSV files and folder/file names. For example, it may be convenient to extract independent variables (input parameters) and find image and data files using the folder hierarchy, while using a CSV file to specify dependent variables (outputs or results from the solver). You will need to import these in two steps, but Tecplot Chorus will match up the data from both sources based on the input parameters for each case. Similarly, you can import multiple CSV files, which may contain different cases, different variables for the same cases, linked data or image files, or a combination of these.
Tagging Image and Data Files
Each external file image or data file is identified by a tag, rather than by file name, within Tecplot Chorus. This way, images or data files that have the same sort of content, but whose filenames vary, can be brought together under a single identifier—the tag—in your project. When comparing images or data files, only files having the same tag may be compared.
For example, you might tag files as Data, Image and/or Layout if you have only one of each kind of file. If you have multiple images, you could tag them Pressure Contour, Streaklines, and so on, according to what they show. The tagging scheme you use is entirely up to you.
Tags cannot be changed once they have been added to a project, although they can be removed and re-added. A few moments' consideration when linking image and data files can make things go more smoothly, especially when you will be working with others on analyzing your results.
It is not required that every case in a project have an associated file for each tag. For example, if you only have contour images for some of your cases, you could still assign these images a tag called "Contour Image" without error. The tag would merely be unavailable for cases that do not have an associated contour image.
For some kinds of data, it is possible to associate more than one file with a tag, and in some cases it is required. The following types of files are limited to one file having a given tag per case:
-
Images (.jpg, .png files)
-
Tecplot layouts (.lay files)
-
Tecplot layout packages (.lpk files)
Some non-Tecplot data formats, such as Fluent and PLOT3D, use two physical files per data set, one for the coordinates and one for the rest of the variables. In this case, you must give both files the same tag when adding them to the project so that Tecplot Chorus will know they should be opened together when you view the case’s data.
| For more information on working with non-Tecplot data formats, see Loading Other Data Formats. |
When you append new data to a project, you may not use a tag that already exists in the project if any of the cases with which you associate new files already have any files with that tag.
Although only one image file per case may be associated with a tag, you may create a tag group to collect related images together. Tag groups provide an easy way of viewing related images in some Tecplot Chorus windows and also allow you to specify the order in which images in the group appear in those views.
Interface
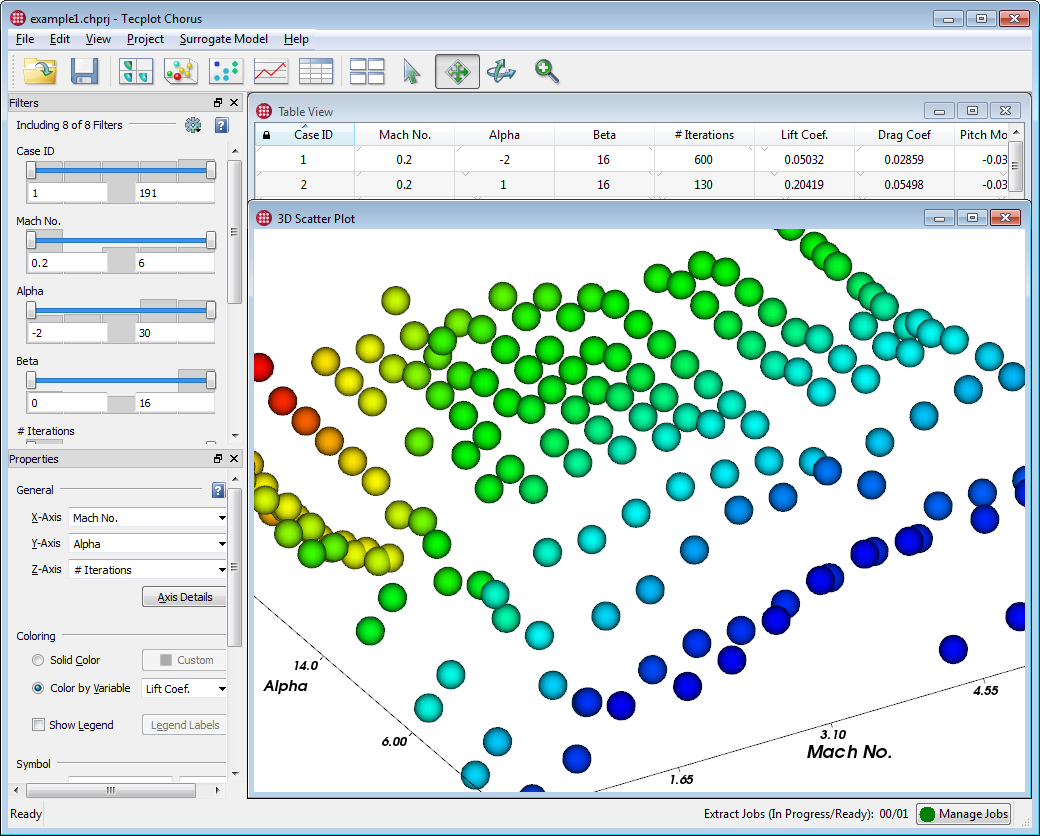
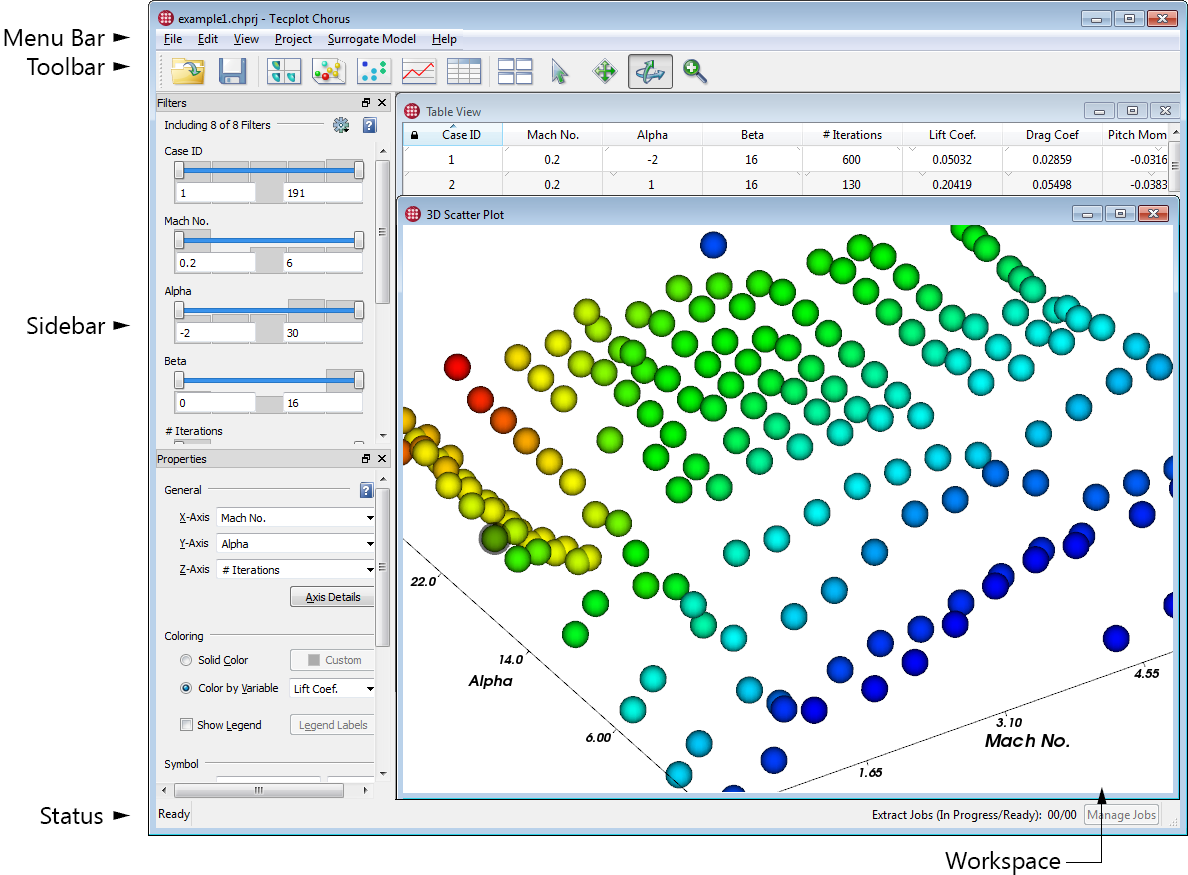
The main Tecplot Chorus user interface is divided into five sections.

- Menu bar
-
Pull-down menus at the top of the screen that provide access to Tecplot Chorus features. (See Menu Bar.)
- Toolbar
-
A row of buttons just below the menu bar that provide one-click access to commonly-used Tecplot Chorus features. (See Toolbar.)
- Sidebar
-
Initially displayed on the left side of the Tecplot Chorus window, contains the Filter panel for filtering data and the Properties panel for changing the settings of various types of plot and view windows. These panels can be moved independently to the right edge of the window or moved out of the window entirely (for example, to a second display).
- Workspace
-
The largest section of the main Tecplot Chorus window holds sub-windows that show various analysis views of your projects. You can have multiple sub-windows open at a time and move, resize, and tile them. They can also be moved outside the main window if desired.
- Status
-
A line at the bottom of the Tecplot Chorus window that displays information about what the program is working on at the moment. When a project is open, it also shows the status of background jobs and provides easy access to the Manage Jobs feature.
Menu Bar
The Tecplot Chorus menu bar appears at the top of the workspace and is divided into five broad classes of functionality.

- File
-
Open and save session files (see Sessions). Create or open projects (see Projects). View the Dashboard (see Welcome Screen). Exit Tecplot Chorus.
- Edit
-
Undo and redo actions.
- View
-
Open various types of views of your project (see Exploring Your Results). Also reset any of these to their default settings. Show or hide the sidebar panels.
- Project
-
Manage the current project (see Projects). Append additional data; set root path; change variable nature. Calculate new variables from existing ones. Export data from the project. Remove links to auxiliary files.
- Surrogate Model
-
Change surrogate model settings (see Surrogate Models).
- Help
-
Get help with Tecplot Chorus. Edit licensing details and display information about the product.
We recommend taking a few moments the first time you use Tecplot Chorus to familiarize yourself with the menus.
Toolbar
The Tecplot Chorus tool bar, positioned by default just below the menu bar, provides single-click access to commonly-used features and views. From left to right, the buttons are divided into three categories.

| The toolbar can be dragged out of the main Tecplot Chorus window using the "handle" at its left edge. The toolbar can be "docked" at any edge of the window (not just the top) by dragging it near the window edge. Docking the toolbar to the right or left edge of the window can be a convenient layout for users with wide-screen displays. |
Session Management
Allows you to load and save your active session in a file. A session (.chses file) stores information about the open project, all open windows, and the state of the Tecplot Chorus user interface, so when you reopen it you are right back where you were when you saved it. See Sessions for more information.
 Open Session
 Save Session
Project Analysis
Give you various views of the results in your projects. See Exploring Your Results for more information.
| You may have any number of any of these plots and views open simultaneously, subject only to the limits of your operating system, available memory, and good taste. |
 New Matrix View (see
Matrix Views)
 New 3D Scatter Plot (see
Scatter Plots)
 New 2D Scatter Plot (see
Scatter Plots)
 New Line or Symbol Plot (see
Line and Symbol Plots)
 New Table View (see Table Views)
View Management
 Tile Windows
-
Tidy up your plot and view windows so you can see all of them.
This tool is available only when at least one plot or view window is open.
 Select
-
Lets you select individual cases or groups of cases in plots and other data views.
|
Hold the Control key while clicking to toggle the selection status of the clicked case. Drag a rectangle or (in some views) hold Shift while clicking to select groups of cases. Hold the Control key while dragging to add the chosen items to (or remove them from) the existing selection rather than making a new selection. |
 Translate
-
Lets you move 3D plots within their window. For 2D and line plots, the axes stay in place while the data moves (that is, the axes' ranges change).
 Rotate
-
Lets you rotate 3D plots. Not available for 2D or line plots.
 Zoom
Zoom-
Lets you zoom in and out of plots.
-
In 2D plots, drag a rectangle around a region you wish to fill the window; the axes stay in place while the data moves (that is, the axes' ranges change).
-
In 3D plots, hold the right mouse button and drag the mouse up or down to zoom in or out.
-
| You may also zoom plots when any tool is active by placing the mouse pointer in the window to be zoomed and moving the mouse’s scroll wheel. |
Sidebar
The Tecplot Chorus sidebar has two panels. These panels may be dragged from the Tecplot Chorus main window to make them independent windows that may then be positioned anywhere on your computer’s displays. They may also be docked to any edge of the main Tecplot Chorus window in a manner much like the Toolbar. Although they may be docked to the top and bottom edges, the left and right edges are more useful places for them.
If you attempt to dock both sidebar panels in the same location, Tecplot Chorus will display only one at a time, and you can switch between them using tabs at the bottom of the sidebar area.
The panels can also share space (drag one on top of the other, but toward the top or bottom end), in which case you can drag the divider between them to determine the allocation of space between the two panels.
The available sidebar panels are:
- Filters
-
Sets the range of data displayed in plot, table, or matrix views (see Filters) and the filters displayed.

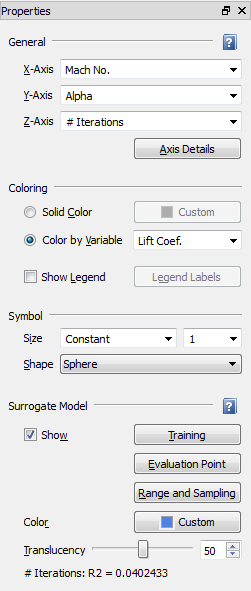
- Properties
-
Sets options for plots and other views. The exact controls available depend on the type of window that is active (a 3D Scatter Plot’s properties panel is shown here).

Workspace
The Tecplot Chorus workspace displays the views of the current project, including tables, matrixes, and plots. From these windows, you can open additional windows, for example to view or compare images from a case. These also appear in the workspace. Views of data files appear separately in Tecplot 360.
Windows can be resized by dragging from the edges. The window’s title bar also includes the usual buttons for closing, minimizing, and maximizing the window. (If a window is maximized, these buttons are above the right edge of the toolbar.)
Any window may be freed from the workspace by dragging it out of the main Tecplot Chorus window. At this point, it may be moved to another monitor, maximized to fill the screen, and so on. These windows automatically appear in front of the main Tecplot Chorus window. Closing the emancipated window will return it to the Tecplot Chorus workspace.

The  Tile Windows button makes all workspace windows
visible by resizing and positioning them so they do not overlap. Only windows in the
Tecplot Chorus workspace are tiled; windows you have dragged out of the main Tecplot
Chorus window are not affected. Tile Windows button makes all workspace windows
visible by resizing and positioning them so they do not overlap. Only windows in the
Tecplot Chorus workspace are tiled; windows you have dragged out of the main Tecplot
Chorus window are not affected.
|
Status
The Tecplot Chorus status line displays the name of the currently open project, along with progress information for any background jobs currently in progress. The status bar appears when a project is active. (It is not initially visible when you launch Tecplot Chorus.)

At the right end of the status bar is information on any background extraction jobs being performed by Tecplot Chorus. Click to see the status of individual jobs or to cancel a job (see Creating Images). This button is not available when there are no active background jobs or when no project is open. A green circle in the Manage Jobs button indicates that a background task has recently completed and is ready for your attention.
Sessions
In Tecplot Chorus, a session refers to the current state of the software, including the current project, tag groups you have defined, any open plots or views, and all surrogate model settings. Image difference windows, however, are not part of the session.
Sessions are useful for two different scenarios:
-
Save a session when you quit Tecplot Chorus for the day, and pick up where you left off the next time you use the software
-
Save one or more sessions as "templates" for the views you typically work with, then start using Tecplot Chorus by using one of these sessions
You may save your session to a .chses file by choosing or by clicking the  button on the toolbar.
When later opened using or the
 button, Tecplot Chorus is restored to its state at
the time the session file was saved.
Getting Help
Tecplot Chorus includes the following documents to help you learn about the software.
- User’s Manual
-
Explains the product’s features and user interface.
- Getting Started Manual
-
Tutorials that will give you hands-on experience with the product.
If you get stuck, don’t panic! Help is available right inside Tecplot Chorus. Simply choose Tecplot Chorus from the menu to see a table of contents, or click the or button in any dialog or sidebar that has one to get help for that part of the software.
If you have an active TecPLUS subscription, you may also call +1 425 653 9393 to reach Tecplot’s Technical Support staff. Assistance is available by telephone from 6:30 A.M. to 5 P.M. Pacific. Our Technical Support staff can also be reached at support@tecplot.com.