Analyzing Individual Cases
Once you have located cases of interest in your project, Tecplot Chorus lets you view images or data associated with them. Supported image formats open directly in Tecplot Chorus, while supported data files (such as Tecplot layouts) open in Tecplot 360.
In Tecplot 360, you can create a style sheet from a single case and use it as a template to generate new images for other cases. These images are then available in your Tecplot Chorus project.
Viewing Images
JPEG or PNG Images associated with one or more cases can be viewed by selecting the cases, right-clicking them, and choosing from the context menu.
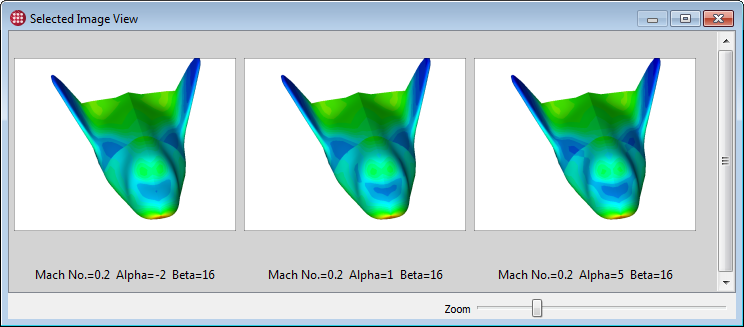
A new image viewer window appears.
|
You can resize, minimize, and maximize windows inside the Tecplot Chorus workspace. The You can also drag view windows outside the Tecplot Chorus workspace and move them anywhere on any display. Such windows always appear in front of the main Tecplot Chorus window and thus in front of any windows still inside its workspace. |
If you have selected a single case, all images associated with that case initially appear in the image viewer. If you have selected multiple cases, the image viewer initially shows an image from each selected case that has images under the default tag. (See Tagging Image and Data Files for more about tags.)
Image Viewer Controls
 Zoom
Zoom-
The zoom slider at the bottom of the window makes the individual images larger or smaller.
Image Viewer Properties
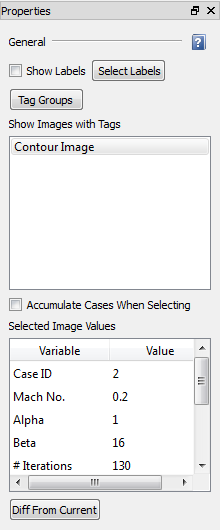
The following controls appear in the Properties panel when an image viewer window is active.
- Show Labels
-
Activate the checkbox to label each displayed image with variable values from its case.
Click to choose the variables to be shown using the Label Images dialog. The Label Images dialog also appears automatically the first time you activate the Show Labels checkbox.
- Tag Groups
-
Opens the Tag Groups dialog to allow you to create and modify tag groups. See Tag Groups.
- Show Images with Tags
-
Choose which images to display for each case by choosing the tag or tag group.
You may choose multiple image tags or groups by holding Shift or Control while clicking items in the list to toggle the state of individual tags or to select contiguous ranges of items.
If you select a single tag, all selected cases will display the associated images having that tag next to each other, wrapping to new rows to fit the window. If you select multiple tags, including a tag group containing more than one tag, the images will be arranged in a grid; cases are rows and tags are columns.
See Tagging Image and Data Files for more details about tags.
If a case doesn’t have an image associated with a selected tag, that space will be left blank. To see which cases are missing images, turn on the labels. - Accumulate Cases When Selecting
-
If this checkbox is marked, you can add cases to this image viewer by selecting them in any Tecplot Chorus view (for example, a table or matrix view) or plot. Only cases not already shown in the image viewer are added. The images displayed depend on the tags selected in the image viewer’s Show Images with Tags list.
To remove cases from the image viewer, select the image or images to be removed, then right-click and choose from the context menu. All images associated with that case are removed from the image viewer. (This applies only in the current image viewer.)
- Selected Image Values
-
Displays the values of all variables from the cases associated with the selected images in a scrollable table.
If multiple cases are selected, the text "(Multiple values)" appears next to any variable that does not have the same value in all selected cases.
- Diff From Current
-
Displays images highlighting the differences between the current image and the others in the window (see Showing Image Differences).
Image Difference Properties
When viewing image differences, the Properties sidebar displays the values of all variables from the cases associated with the selected images in a scrollable table. If multiple cases are selected, the text “(Multiple values)” appears next to any variable that does not have the same value in all selected cases.
Removing Cases from the View
To remove cases from the image viewer, select an image associated with the case or cases to be removed, then right-click and choose from the context menu. All images associated with that case are removed from the image viewer. The deletion applies only to the current image viewer; no cases or images are deleted from your project.
Exporting Images
You may export selected images from the viewer, or copy one to the clipboard, by right-clicking and choosing or from the context menu. Any labels enabled in the Properties panel are included in the image.
When exporting, the Export Images dialog appears.

- Filename
-
The directory where the file will be placed. If you are exporting a single image, you can also enter the filename here. If you are exporting multiple images, you specify only a directory and Tecplot Chorus names the files. Click to specify this using a Save dialog.
- Image Width
-
The width of the exported image in pixels. The height is determined by the image’s aspect ratio. Mark the Use Original Image Width checkbox to use the original image dimensions.
Exported images are saved in PNG (Portable Network Graphics) image files.
Showing Image Differences
To display the differences between one image and others in the image viewer:
-
Click the master image (the image to which other images will be compared).
-
Click the button at the bottom of the sidebar.
If multiple image tags are being displayed, the image you select in Step 1 above determines the tag of all images used for the differences.
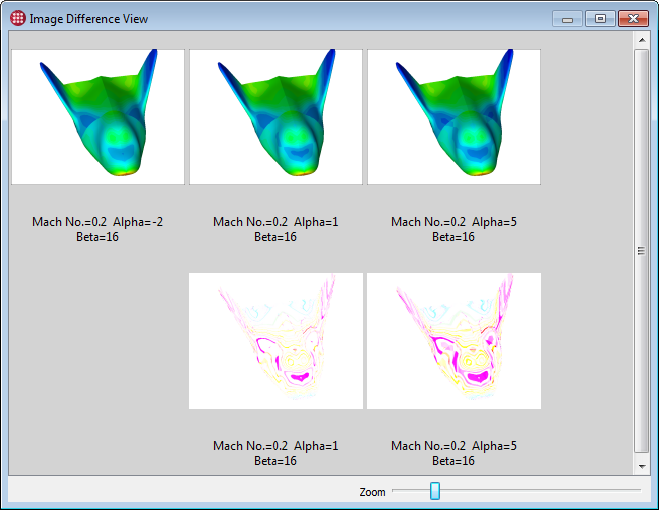
A new window appears displaying the differences between the master image and all other images.
| Images should be the same size and be derived from identical plot styling. Otherwise, the differences displayed may be due to these factors rather than to differences in the solution data. |
The master image is displayed in the first column. Each additional column has two rows: an original image from the image viewer at the top, and a difference image (derived from each image and the master image) immediately below it.
Difference images are created by a bitwise exclusive-or (XOR) of each image with the master image. This process leaves pixels that are the same in both images black. The result is then inverted so that the background is white again. Colors change in ways that tend to make them stand out from the background.
The Properties sidebar displays the values of all variables from the cases associated with the selected images in a scrollable table. If multiple cases are selected, the text "(Multiple values)" appears next to any variable that does not have the same value in all selected cases.
Viewing Data
Auxiliary data files associated with cases may be viewed in Tecplot 360 by selecting the cases, right-clicking them, and choosing from the context menu. We refer to this capability as a "deep dive".
Out of the box, Tecplot Chorus supports loading these file types in Tecplot 360 using :
-
Tecplot Data (.dat, .plt, .szplt, plus nonstandard extensions .bin and .tec as synonyms for .plt)
-
Tecplot Layout (.lay) and Layout Package (.lpk)
-
CGNS (.cgns, .adf)
-
PLOT3D (g.*, *.g, x.*, *.x, xyz.*, *.xyz, in.*, *.in, q.*, *.q, f.*, *.f, fun.*, *.fun, *.nam)
-
EnSight (.case)
-
TRIX (.trix)
-
OpenFOAM (controldict)
-
Fluent (.cas, .dat as well as gzipped versions of these)
Support for additional formats can be added with a little text editing. See Loading Other Data Formats for more information.
Once the data has been loaded, you can use Tecplot 360 to prepare publication-quality plots, compare data from two or more cases, perform various kinds of analyses, and save templates that can be applied to create additional images for your cases.
| Selection works slightly differently depending on whether you are selecting cases in table view, matrix view, or a line or scatter plot. See Exploring Your Results for more information on the procedure for the view or plot you’re using. |
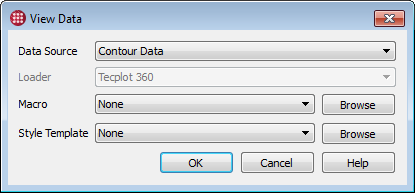
As with images, each data file associated with a case has a tag, which was assigned when the project was imported into Tecplot Chorus. (See Tagging Image and Data Files.) Most types of data files allow multiple files to be associated with a given tag and loaded into Tecplot 360 in a single step.
The Select Data dialog lets you choose the tag of the desired data file or files. If multiple cases are selected, only the tags common to all selected cases are available in the View Data dialog. If the selected cases have no data file tags in common, you will receive an error message instead. Selected cases must have data files with at least one tag in common.
Tecplot Chorus attempts to automatically determine what loader should be used to open the data. If there is only one suitable option, Tecplot Chorus will not allow you to change the loader setting. If more than one loader can be used to open the data, or if an available loader supports more than one configuration, choose the desired loader and option set in this dialog. (See Loading Other Data Formats for more information on loader descriptions.)
After you choose the tag of the data files to be opened, and optionally the method to be used to load the data, choose the macro and the style template to be applied to the file. Click to open a template stored on disk, or choose a recently-used template from the menu.
-
A macro (.mcr file) is a file containing instructions to perform a series of actions in Tecplot 360. A macro can perform virtually any operation that Tecplot 360 can perform interactively, such as slicing, adding streamtraces, calculating new variables, and so on. You can record a macro file in Tecplot 360’s Scripting Menu and apply it to any data file you open from Tecplot Chorus.
-
A style template (.sty file) is a file containing information about the visual appearance of a single case in Tecplot 360. You can create a style template using the Chorus sidebar inside Tecplot 360.
If you have not created any templates yet, or if you wish to use a default view, choose None.
Click to open Tecplot 360 and display each selected case’s data in its own frame.
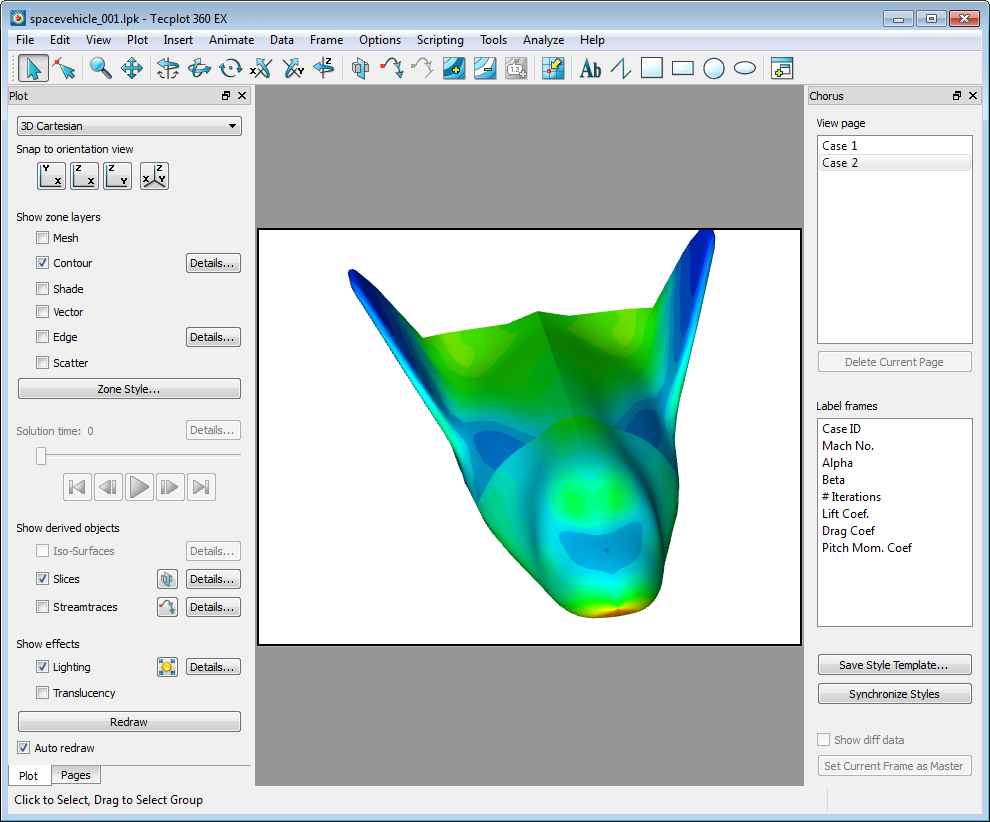
A powerful post-processing tool is now available to you to further investigate the actual data from your cases. The Chorus sidebar appears docked to the right of the Tecplot 360 workspace.
The Chorus Sidebar

The Chorus sidebar provides integration between Tecplot Chorus and Tecplot 360. Like all sidebars in both products, it can be snapped to any edge of the workspace, docked with other sidebars, or undocked from the main Tecplot 360 window and positioned as desired. If you accidentally close the sidebar, you can re-open it by choosing while in Tecplot 360.
The Chorus sidebar has the following functions:
- View Page
-
When you choose to view data in Tecplot Chorus and Tecplot 360 is already open, a new page is created, rather than opening a new instance of Tecplot 360 each time. This saves memory and time.
You can choose which page you wish to view from this scrolling list, or delete the selected page by clicking the button.
Data files that appear on pages that are not currently visible may still use memory. Tecplot 360 will load data only as it is needed for display, but if you are working with large data files or have limited resources, you may experience poor performance with multiple pages open. If this happens, close pages that you do not currently need. - Label Frames
-
Determines how the frames are labeled, similar to the Show Labels feature when viewing images in Tecplot Chorus (see Image Viewer Controls).
-
Click a variable to display that variable’s value in each frame.
-
Hold the Control key while clicking a variable to toggle its selection state. This can be used to select additional variables or to turn off the display of variables you don’t want.
-
To select a contiguous range of variables, click the first variable in the range, then, while holding the Shift key, click the last variable in the range. To select additional contiguous ranges, hold Control while performing this maneuver. Alternatively, you can click and drag the mouse to select a range of values.
-
- Save As Style Template
-
Click to save the appearance of the current frame (that is, all style information) in the Tecplot Chorus project for later application to other cases. A Save dialog appears to allow you to save the file. Name the file as you like and click .
- Show diff Data
-
Allows you to display differences between cases, if multiple cases are open.
First, click the frame containing the master case (the case to which you wish to compare other cases) and click . Then activate the Show Diff Data checkbox.
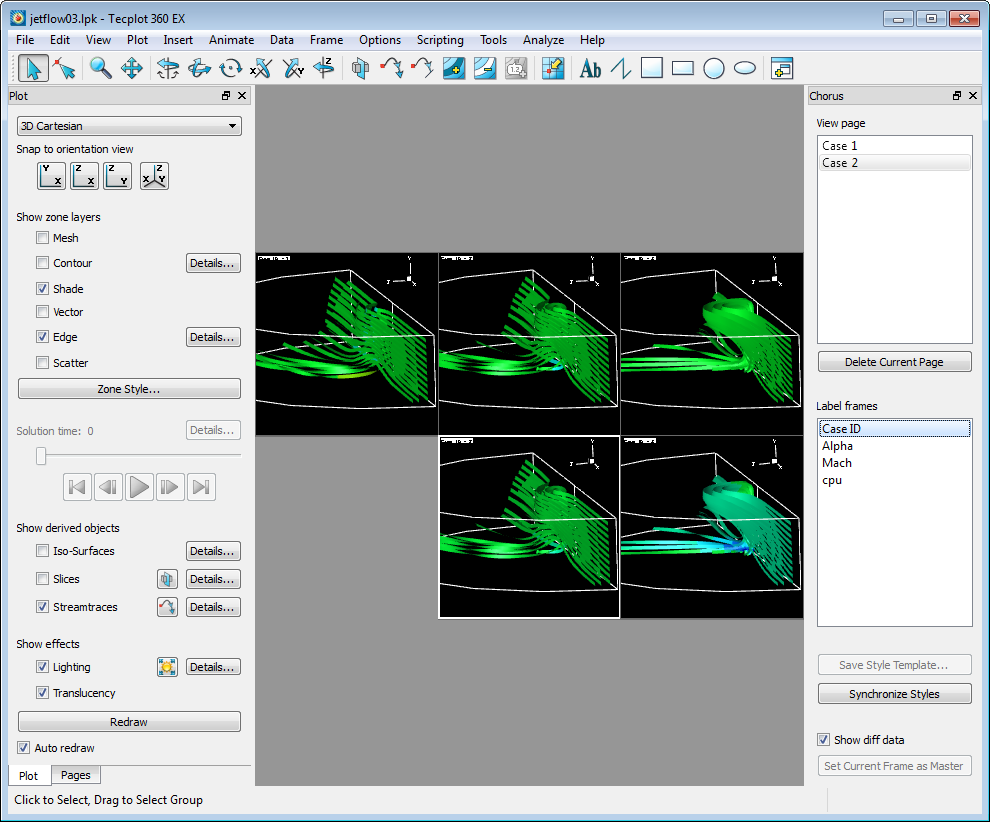
Similar to the image comparison feature in Tecplot Chorus proper (see Showing Image Differences), the master is shown on the left. Each additional column shows one case’s original data and, below it, a difference frame calculated between that case and the master case.
Unlike image comparison, this is a comparison of the actual underlying data. You may want to use different styling on the difference frames to better reveal this.
- Synchronize styles
-
Click to copy all style information from the current frame to all other frames. This is how, for example, you can move the frame label on all frames: simply move it in one frame, then synchronize styles.
Creating Images
You can have Tecplot Chorus generate new images for some or all of the cases in your project. based on the original data file associated with them. You may wish to do this if you do not already generate images using a post-processing step, or you may want to produce additional images to better visualize details that have only become apparent after a "deep dive" into selected cases (see Viewing Data).
| The data files used to create new images must be in formats that can be opened for viewing in Tecplot 360 from within Tecplot Chorus. See Viewing Data for a list of the formats supported by Tecplot Chorus out of the box, or Loading Other Data Formats if your data is in another format. |
To create these new images, Tecplot 360 applies a style template to each case’s data file to determine the appearance of the image. To create a style template:
-
View a typical case as described in Viewing Data.
-
Zoom, rotate, and style your plot as desired.
-
In the Chorus sidebar, click and save the new style template.
Once you have created a style template, you may apply this template to any or all cases in your project to generate new images as follows:
-
Select the cases for which you want to generate new images.
The exact procedure varies based on what type of view or plot in which you select the cases; see Exploring Your Results for detailed instructions for each view.
To generate new images for all cases in your project, open a table view and press Ctrl+A to select all cases. -
Right-click the selection and choose from the context menu. The Create Images dialog appears.
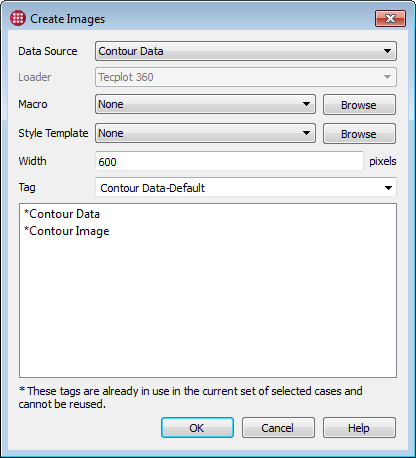
In the Create Images dialog, specify:
- Data Source
-
The tag of the data file that will be used to generate the image. (See Tagging Image and Data Files for more about tags.)
- Loader
-
Choose the Tecplot 360 loader (and optionally the loader settings) to be used to load this data. If only one loader is suitable, or if the data is in a native Tecplot format, Tecplot Chorus chooses it for you automatically. (See Loading Other Data Formats for more information on loaders.)
- Macro
-
A Tecplot macro (.mcr file) that will be run before the style template is applied to each data file. Click to choose the macro file or pick a recently-used macro from the menu.
- Style template
-
The Tecplot style template (.sty file) that should be applied to each data file to produce a styled image. Click to choose the style file or choose a recently-used template from the menu.
- Width
-
The desired width of the image in pixels. (The height will be calculated automatically based on the aspect ratio of the plot frame.)
- Tag
-
The tag by which this type of image will be known in Tecplot Chorus when choosing to view images. (See Tagging Image and Data Files.)
Tecplot Chorus begins creating image files for the selected cases in the background.
|
For data files whose locations are specified by relative paths, Tecplot Chorus writes the image files it generates to folders it maintains inside your project root folder (check ). If your project root is on a network volume, make sure that all users who will be generating data files with Tecplot Chorus have the proper permissions for creating folders and files in this directory hierarchy. For data files specified using absolute paths, the generated image files are written in the same directory as the data file they were generated from. |
Manage Jobs
The Manage Jobs window lists all Chorus background tasks currently in operation. In this window you may see these tasks’ status or cancel them. Click the button in the status bar to see this background task in the Manage Jobs window.
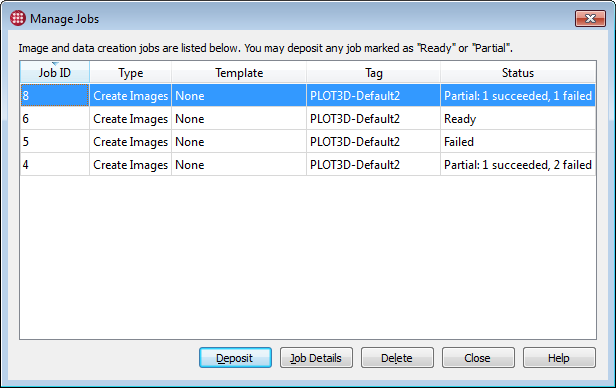
The status messages displayed include:
- In Progress
-
Tecplot Chorus is currently processing the job.
- Ready
-
Tecplot Chorus has finished processing the job and results from all cases are ready to be deposited.
- Failed
-
An error occurred during the processing of the job and no results were produced.
- Partial
-
Errors prevented some cases from being processed, but others were processed successfully and are ready to be deposited. The status message indicates how many cases were processed successfully and how many failed.
When a job’s status is Ready or Partial, select it in the list and click the button to import the images, data files, or extracted variables to the project. Tecplot Chorus then starts a wizard to append the new data to the project (see Appending To a Project).
Creating Data Files
Besides images, Tecplot Chorus can create layout packages (.lpk files) for selected cases. A layout package is a Tecplot data file that specifies a default style and view along with the subset of the original data set required to reproduce the current view in Tecplot 360. For example, zones and variables that are not visible are omitted from the .lpk file. Layout packages are an ideal format for sharing interactive views of your data (rather than static images) with colleagues.
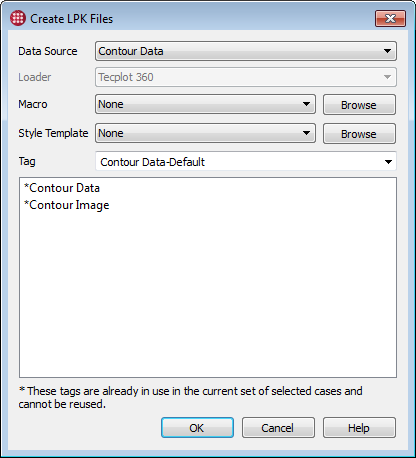
The procedure for creating layout files is very similar to that described in Creating Images for creating images; review that section for details. First, open a typical data file in Tecplot 360 and create a style template (see The Chorus Sidebar). Then select the cases for which you want to generate layout packages, right-click them, and choose from the context menu.
If the selected cases have more than one data file, you will need to choose a data file tag to act as a source for the layout packages. Then you’ll enter a name for the generated file, assign it a tag so it can be accessed in Tecplot Chorus (see Tagging Image and Data Files), and select the style template you created. You may optionally choose a loader if the default loader setting is not appropriate and also choose a Tecplot macro file to be run after each file is loaded. (See Loading Other Data Formats for more information on loaders.)
Tecplot Chorus processes the job in the background. Click the button in the status bar to see the job’s status in the Manage Jobs window and, when it has finished, deposit the complete or partial results in your project.
| Tecplot Chorus writes the data files it generates to folders it maintains inside your project root folder (check ). If your project root is on a network volume, make sure that all users who will be generating new data files with Tecplot Chorus have the proper permissions for creating folders and files in this directory hierarchy. |
Tecplot Chorus then starts the wizard to append the new files to the project (see Appending To a Project).
Extracting Variables from Data Files
Tecplot 360 supports loading metadata from your model results in Tecplot format, as well as from selected third-party formats. Tecplot 360 can also perform additional analysis and save the results as metadata (see the CFD Data Analysis section of the Tecplot 360 User’s Manual).
By calling on Tecplot 360, Tecplot Chorus can load the metadata from your results as variables in a project. Tecplot Chorus can also be directed to use Tecplot 360’s analysis capabilities to calculate additional values.
To extract variables:
-
Select the cases for which you want to extract variables.
The exact procedure varies based on the type of view or plot in which you select the cases; see Exploring Your Results for detailed instructions for each view.
To extract variables for all cases in your project, open a table view and press Control-A to select all cases. -
Right-click the selection and choose from the context menu. The Extract Variables dialog appears.
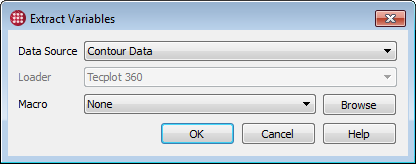
In the Extract Variables dialog, specify:
- Data Source
-
The tag for the data file from which variables are to be extracted.
- Loader
-
If the data file is not in Tecplot format, choose the loader that will be used to load it.
- Macro
-
This may be a macro file, previously written or recorded with Tecplot 360, that extracts the desired data using tools on the Analyze menu. Tecplot 360 will run this macro file for each case that is loaded and pass the analysis results to Tecplot Chorus, where they will be inserted into your project. Choose None if your solver provides the variables you wish to extract.
See the next section, Recording an Analysis Macro, for instructions on recording a macro file in Tecplot 360 for use with the Extract Variables feature.
-
Click . Tecplot Chorus begins extracting the variables from the selected data files in the background. When this process is complete, it will be counted as "Ready" in the status bar. Click the button to deposit the results in your project.
Recording an Analysis Macro
To record a macro for use with the Extract Variables feature:
-
Launch Tecplot 360.
-
In Tecplot 360, load a data file typical of your cases.
-
Choose and save the new macro file with an .mcr extension. The Macro Recorder window appears.
-
Perform the desired analysis using the tools on the Tecplot 360 menu. You may perform as many different operations as you like; the results of each operation will be picked up when Tecplot Chorus extracts the variables from each case in your projects. However, if you perform the same operation more than once, only the last results from that calculation will be available.
-
Click in the Macro Recorder window.
Custom Actions
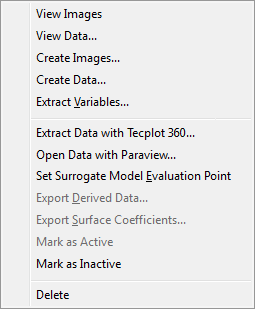
You can extend Tecplot Chorus to allow you to perform other actions on selected cases. Two sample custom actions are included with Tecplot Chorus.
- Extract Data with Tecplot 360
-
Executes a Tecplot 360 macro that extracts a slice from each selected data file and writes the slice data to its own file. A link to this file is then added to your Tecplot Chorus project. This action may be modified to invoke other macro files for other purposes.
After extraction has finished, click at the bottom of the Tecplot Chorus window, select the job, and click.
- Open with Paraview
-
Opens a data file associated with the first selected case using the open-source Paraview data visualization tool.
When enabled, custom actions appear on the context menu when you right-click selected cases in any view or plot. See Actions for more information on this feature.
