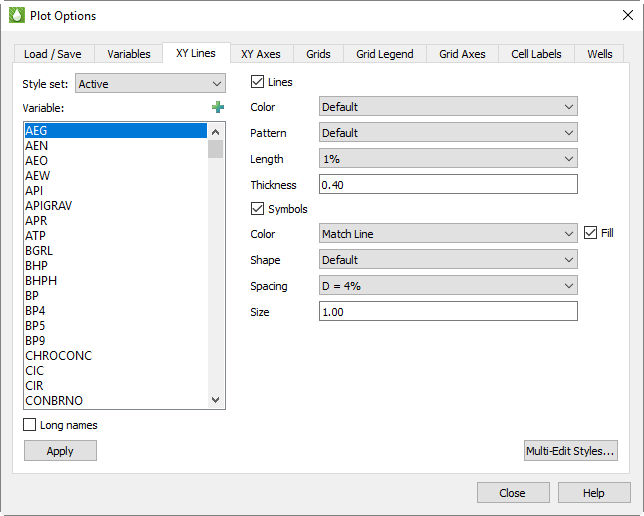
The options on the XY Lines page of the Plot Options dialog provide style controls to change line and symbol properties for the variables in your style sets. You can quickly access this page by double-clicking on any line representing data in an XY plot
.
You can design up to 100 complete sets of styles – one for the active data set and one each for up to 99 comparison data sets. The Style Set menu controls which set you are altering. Initially, the settings in RS Variables Files define the “default” values for each property, with the exception that the Lines Pattern is cycled for the comparison style sets to differentiate them from the Active Style Set. Each Style Set is applied to the data set(s) included in a comparison plot according to the order specified on the Order page of the Compare Data Sets dialog. (For example, Comp 1 is applied to the first file listed on the Order page.) Refer to Chapter 10: “Comparing XY Data” for more information on specifying comparison values.
You can specify the style for each variable in each Style Set. Typically, you would only edit the styles applicable to the plots you are creating. Often the default settings display sufficiently. To quickly edit a line style, double-click on the specific line in the XY plot of interest. This will bring up the XY Lines page with the appropriate Style Set and Variable pre-selected in the dialog. After you make several changes to line styles you should save a style file using the Load/Save page of the dialog. If you create or use an existing Project file, Tecplot RS will automatically save all of the style changes to the Project file.
To edit multiple combinations of variables and style sets, click the Multi-Edit Styles button (see “Multi-Edit XY Line Styles” on page 403).
The Variable box includes all the names included in Section F - 2.1 “Master Variables List”, including settings for entities. Use it to choose the variable for which you want to change the comparison style settings. The variable is automatically selected if you accessed this dialog by double-clicking on a line in an XY plot. Click the  button in the upper-right corner of the list to launch an expanded, searchable list. This helps particularly for very long lists.
You can also use the Variables page of the Plot Options dialog and manage this list of variables by sorting it alphabetically and limiting it to just the variables that appear in your data files.
Toggle-on “Long Names” to display the full name of the variable (as defined in the Master Variables List). When “Long Names” is toggled-off, Tecplot RS uses an abbreviation.
Tecplot RS uses the variables named “Entity1” through “Entity9” or “ST1” through “ST9” to customize the style settings for entities used in XY Entities plots. “Entity 1” / ST1 correspond to the first entity in the plot, and so forth.
The style selection options are initially set to default settings defined in the RS Variables file for a given variable or set of variables. To edit the settings, use the Variables page of the Plot Options dialog to change them interactively, or create a personal RS Variables file and edit it. Refer to Section F - 2.1 “Master Variables List” and Section C - 2 “Editing RS Variables Files” for instructions.
The options are grouped for lines and symbols, as follows:
• Lines or Symbols - Controls whether lines and/or symbols display. If you toggle-off both switches, Tecplot RS will display nothing in the plot for the corresponding variable and Style Set. These settings also depend on the master toggles for Lines and Symbols provided at the top of the sidebar for XY plot types.
 When you work with a variable that is repeated in multiple Style Sets and you wish to display it only once, toggle-off both “Lines” and “Symbols” for that variable in the other Style Sets. That variable will not be included in the plot of legend for the associated data set. This is useful when comparing multiple Eclipse history match runs in which the output file for each run includes the historical data.
• Color - Choose from 26 standard colors or Default, which uses the color defined in the Master Variables List. For symbols, you can also choose the “Match Line” option. This option sets the symbol color to match the color of the line. The symbol color will update whenever the line color is changed.
• Pattern - Six line patterns are offered, plus the Default option that reads the pattern from the Master Variables List.
• Pattern Length - You can alter the repeat length of the pattern. Values are expressed as a percentage of frame size.
• Thickness - You can select the thickness of the line. Again, Tecplot RS measures these values relative to the frame size.
• Symbol Shape - Seven shapes are offered, plus options for Default and Character. When Default is selected, the shape is taken from the Master Variables List.
When Character is selected, a small text field will display. Use this to input the alpha or numeric character to be used as a line symbol. For example, you may want to use “W” for water variables, “G” for gas, and so on.
• Symbol Spacing - The “All” option will plot a symbol at each data point. Use the “D” options to space symbols at approximately even intervals along the line, with the spacing value expressed as a percentage of frame size. The “I” spacing options are skip values. For example, I = 6 will place symbols at every sixth data point.
• Symbol Size - Tecplot RS expresses sizes as a percentage of frame size.