The Grid Legend page of the Plot Options dialog includes selections for formatting the range and style of the grid variable legend that displays for 2D Grid Plots and 3D Grid Plots. Access this dialog quickly from any grid plot by double-clicking on the legend.
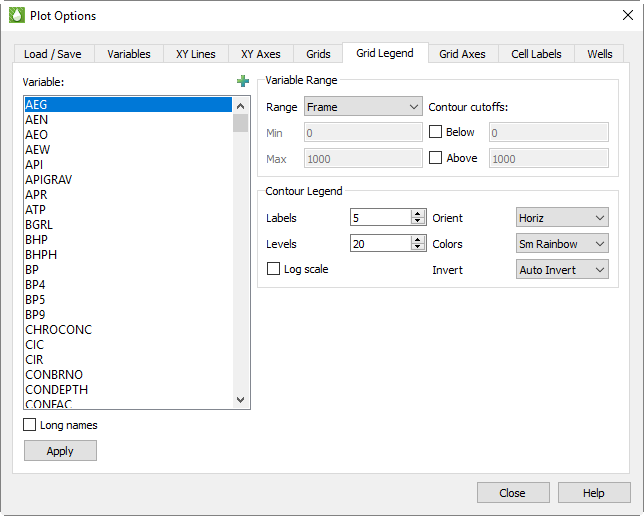
The selections you make on this page apply on a variable-by-variable basis. In the Variables region of the page, select the variable you wish to customize in the other regions of the page.
• Variable - The Master Variables List displays in the Variables box. When you double-click on the legend, the corresponding variable automatically displays as selected when the page displays. Click the  button to launch an expanded, searchable variables list. This helps for very long lists.
The variables in the box come initially from RS Variables Files. Tecplot RS appends derived variables and variables that occur in loaded data files to this list. To change a setting for a variable in this master variable list, refer to Section F - 2 “Variables” or Section C - 2 “Editing RS Variables Files” for instructions.
• Long Names - Toggle-on “Long Names” to display long variable names in the box. Otherwise, the short (acronym) names display.
In the Variables Range region of the page, you can customize the range for which each variable displays in your plot. This region includes the following options:
• Standard Deviation Range - Select this option to set the minimum and maximum limits to 1 or 2 standard deviations from the mean value. For example, if “1 standard deviation” is selected, then the variable range minimum will be mean - standard deviation and the maximum will be mean + standard deviation. Note that standard deviation and mean are calculated such that they are identical to the standard deviation and mean values displayed in the histogram plot.
• Other Ranges - This menu contains three options for determining the minimum and maximum limits for the ranges of the variables:
• Frame - The limits will be computed to encompass the range of the variable values across all time steps. This gives an individual scale for each frame, making it easier to see how a variable functions in each frame.
• Data - The limits will be computed to encompass the range of the variable values across all time steps. This gives a common scale for all frames, making it easier to see how one well compares to another.
• Manual - Use this option to control the minimum and maximum values for the legend ranges manually, by typing the values in the fields.
In the case of grid legends, the Frame or Data selections operate identically. The legend will encompass the full range of variable values for all time steps.
• Min and Max - These text fields activate when the Manual range is selected. Type the minimum and maximum values of the ranges in these fields when using the Manual variable range.
|
|
 For the majority of applications, setting the range to either Frame or Data will produce reasonable results.
• Cutoff Below/Above - Toggle-on “Below” or “Above” to remove contour variable values below or above a given cutoff, respectively. Type the cut-off value in the corresponding text field. The cells within the cut-offs will display without color.
Use the Contour Legend region of the dialog to customize the style of your contour legend for each variable. You have the following options:
• Labels - Use the Labels box to specify the number of contour labels to display in your legend. Changing the number of labels in the contour legend will also change the number of labels on the contour lines themselves, and vice versa.
• Levels - Use the Levels box to specify the number of contour levels to display in your plot. The Levels and Labels values are used to calculate legend intervals that will display “nice” numbers for the legend labels.
• Log - Toggle-on “Log” to use a log scale for the levels used in the legend. Use Labels and Levels settings that produce a “nice” look for the legend.
• Orient - Specify whether to have a vertical or horizontal contour legend.
• Colors - Use this menu to specify the color map to use for your contour plot. Using colors from this menu instructs Tecplot RS to color different ranges of variable values different colors. For example, with the small rainbow color map (“Sm Rainbow”), Tecplot RS will shade the smallest values blue, then green, then yellow, and the highest values red.
• Invert - Use the Invert menu to invert the color map. Choose from one of the following color map settings:
• Auto Invert - Select “Auto Invert” to invert the colormap only when water saturation is set to the contour variable. When using the small rainbow color map, this associates blue with the high end of the range. The colormap will be in its standard configuration for all other contour variables.
• Never Invert - Select Never Invert to leave the colormap in its standard configuration for all contour variables.
• Always Invert - Select Always Invert to invert the colormap for every contour variable.