The Extract Data by Cell dialog enables you to extract a range of cells from your grid plot for export into another file or format (this option is not available for XY plots). Open the dialog by going to Data > Extract Cell Data > By Cell.
21 - 2.1 CSV Extractions by Cell
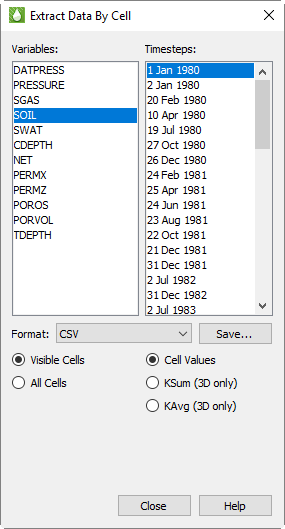 The Extract Data by Cell dialog has various options based on the selected format. When “CSV” displays as the format, the following controls display:
The Variables box lists all of the variables available in the grid. Tecplot RS highlights the first variable by default. Use the Ctrl and Shift keys to highlight a set of variables to include in the output file.
The Time steps box lists all of the time steps available in the grid. Tecplot RS highlights the first available time step by default. Use the Ctrl and Shift keys to highlight a set of time steps.
• Visible/All Cells
The selectable options at the bottom region of the dialog specify whether to save visible cells or all cells. The latter is available only when saving cell values (see next option). The Inside Views region of the sidebar controls the settings for visible cells. You may also use Cell Value Blanking and Pick Blanking to exclude cells from export.
• Cell Values/KSum/KAvg
Choose to save the actual cell values, or KSum or KAvg. The latter are available in only 3D Grid plots and always save the sum or average of visible cells (the Visible/All Cells setting is not used). The output for KSum or KAvg always encompasses the full range of I and J values available in your data. KSum and KAvg output is provided for all grids (global and LGRs) plus all selected variables and time steps.
• Save CSV
Click the Save button to save the data to a csv file. Tecplot RS outputs the data delimited in a column format. For each group of data, one header line indicates the name of the data in each column of output. The static data (ordered by LGR) will appear in the file first. The static data will be followed by all time-dependent data, output by time step, then LGR.
|
|

21 - 2.2 Sector Data Extractions by Cell
You can also choose to output a continuous IJK range of cells, known as a “sector” of data. For example, the group of cells 1-5 in the I-dimension, cells 2-4 in the J-dimension, and cells 2-3 in the K direction could define a sector of data. To output a three-dimensional group of cells like this, choose “Sector Data” from the Format menu in the Extract Data By Cell dialog, and related options will appear in the dialog.
|
|
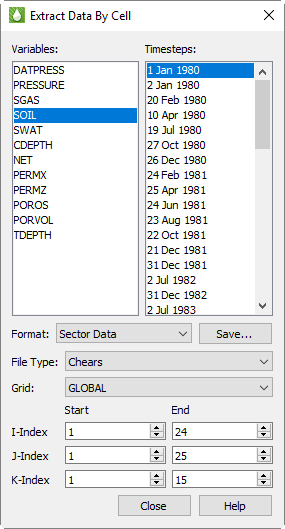 When you choose “Sector Data” from the Format menu, the Variables and Time steps options remain the same as for CSV extraction, but additional controls appear beneath.
• File Type
Choose from Chears, Eclipse, or VIP as the file type of the sector data output file. The output formats match the Property Modifier File Output formats.
• Grid
From the Grid menu, choose the grid from which to pull the data. By default, Tecplot RS will choose the GLOBAL grid.
• I-Index Start and I-Index End
In the Start and End boxes to the right of the I-Index label, indicate the range of cells in the I dimension to extract.
• J-Index Start and J-Index End
In the Start and End boxes to the right of the J-Index label, indicate the range of cells in the J dimension to extract.
• K-Index Start and K-Index End
In the Start and End boxes to the right of the K-Index label, indicate the range of cells in the K dimension to extract.
• Save Sector Data
Click Save to save the sector data to a file of the type chosen (Chears, Eclipse, or VIP).