10 - 2 Using the Compare Toggle
The simplest approach for comparing data sets is to plot them in a single frame using the Compare toggle in the sidebar. This method is available for the following plot types: XY Variables, XY Entities, RFT Plots, Custom XY Plots or XY Custom Entities.
In order to use this function, you must first have multiple data sets loaded. To load another data set, choose “Load XY Data” from the Project menu. You can click the Manage Data button in the toolbar to customize which data set appears as the active data set. (The active data set will determine which entities and variables you can select for plotting.) In order for the comparison to work, the additional data sets must have matching entity names.
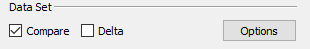
The Data Set portion of the sidebar for XY Variables and XY Custom Plot includes these controls:
The other XY plot types include a similar Data Set portion of the sidebar, without the Show Deltas option.
10 - 2.1 Data Set Selection for Comparison
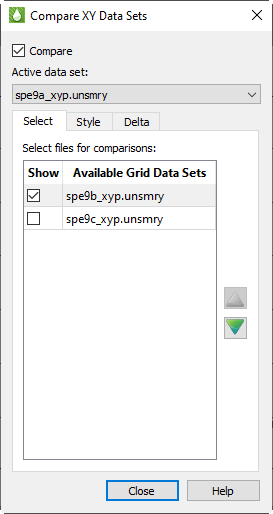
To activate the comparison feature, toggle-on “Compare” in the sidebar. Toggling-on “Compare” will open the Compare Data Sets dialog.
|
|

The name of the active data set displays at the top of the dialog, under “Active Data Set”. The remaining loaded data sets are displayed in the Select Files for Comparisons box. Select the file or files that you want to include for comparison from the box.
|
|

10 - 2.2 Comparable Entities and Variables
The list of entities and variables displayed in the sidebar depends upon the active data set. You can customize the list using the Filtering dialog (open this dialog with the Filter button in the sidebar). For example, you can limit the list of entities to just the wells (don’t include completions, areas, or field data).
To compare entities using the Compare toggle in the sidebar, the selected entity names must match exactly across all files. However, you can define some flexibility with variable names using variable aliases .For example, if the active file uses OPR for oil production rate (typical for Eclipse/SLB files) and a comparison file uses QOP (VIP standard), you can tell Tecplot RS that QOP is an alias for OPR. Aliases are entered using the Variables page in the Plot Options dialog; see Section F - 2 “Variables”.
|
|
 If your data files use different variable names or aliases, you can still compare your data using the XY Freestyle plot; see
 You can edit the Master Variables List to expand the list of variable aliases.
|
|
 Comparison data display is not compatible with the Sum or Avg toggle in