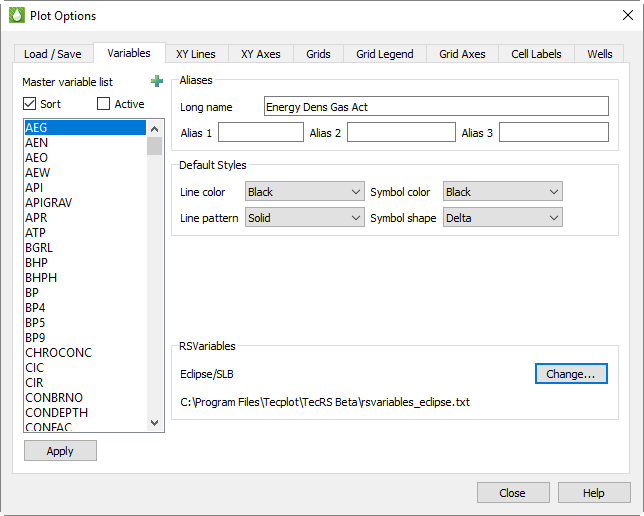
The Variables page of the Plot Options dialog allows you to define default styles and alternative names for all variables in your project. On this page, choose a variable to customize from the Master Variables List on the left side of the dialog, then make the desired changes. The changes are automatically saved
.
Specifically, the Variables page of the Plot Options dialog has the following options to help you customize variables.
The Master Variable List includes every defined and derived variable in your loaded data sets. The list includes all variable names from each of these sources:
• The RS Variables Files file
• All loaded data files
• All derived variables calculated from the Grid Equations dialog and the XY Equations dialog
• Any style files loaded using the Load button on the Load/Save page of the Plot Options dialog
The Master Variables List references each variable by its short name, generally derived from the simulator. A simulator usually generates short names as all uppercase and no more than 8 characters long, but these conventions do not reflect Tecplot RS limitations.
The Master Variable List also includes nine variables named ST1 through ST9. The long names of these variables appear as Entity 1 through Entity 9. Do not delete these variables from the RS Variables file. The XY Entities and XY Custom Entities plot types use these variables (XY Freestyle does as well, occasionally).
In these plot types, a frame contains plots of a single variable for multiple entities (other plot types show a single entity with the options for multiple variables). If the style was based on the variable being shown, a plot showing three wells would have no way of differentiating one well from another.
So for these plot types, Tecplot RS reads the style not from the variable but from the entity number. These ST1 through ST9 represent the nine different entity-specific styles, which you can customize. If you include more than 9 entities in a single frame, the cycle of styles will repeat.
F - 2.2 Sort and Active Toggles
Two toggles appear at the top of the dialog that allow you to control how the Master Variable List appears.
When Sort is toggled-on, variables appear in the Master Variable List in alphabetical order according to their short name. When toggled-off, variables appear first as they do in the active RS Variables file, followed by the names that Tecplot RS added from the data files in the order that it opened the data files. The latter method helps if you want to use an RS Variables file to group variables in order of use.
The Active toggle becomes available when you have at least one data set loaded. When toggled-on, Tecplot RS limits the variable list to only those variables that exist in the current data sets. In general, leave this toggled-on unless you choose to specifically edit the MVL options for all variables. Derived variables that have been calculated in the Grid Equations dialog or the XY Equations dialog will automatically append to the Active list. Also, Tecplot RS will calculate saturation variables that are part of the simulation but excluded from the recurrent data file and include them in the Active list.
In the Aliases region of the dialog, you can define a long name for any variable, as well as up to three short name aliases for that variable. For example, you could define “Oil/Water Ratio” as the long name for the “OWR” variable. In the Paper Layout plot type, you can choose where to display long variable names: in the frame title, the plot titles, and/or the axes of XY plots. See “Title Options” on page 374 for instructions.
• Long Name - To change a variable’s long name, choose the variable in the Master Variables List and type a new long name into the Long Name field in the Aliases region of the dialog. Tecplot RS will accept a long name of up to 80 characters in length, but we recommend no longer than 32 characters.
• Alias 1, Alias 2, Alias 3 - You can define up to three short name aliases for each variable as well. Aliases are useful when you use the Compare toggle in XY plots to view data from multiple files, since Tecplot RS will equate a variable in either file known by one of the aliases with the associated short name in the Master Variable List.
For example, if your simulator outputs “OWR” as the Oil/Water Ratio variable, but your historical data files names the Oil/Water Ration variable “WOR”, include WOR as an alias for OWR. Then Tecplot RS will recognize that the two names refer to the same variable, and will display the correct comparison of that variable between the two files.
|
|
 Aliases do have a unique limitation: Once you define them, you cannot change them with Tecplot RS running. You can add a new alias, but you cannot change an existing one. This occurs because Tecplot RS merges the lists of aliased variables when it loads new data sets. To change an alias, edit the active RS Variables file directly. See
 Below the Aliases region of the Variables page, the Default Styles region enables you to choose default styles in which each variable displays. Use the Line Color, Line Pattern, Symbol Color, and Symbol Shape menus to set the styles used by default when displaying each variable. As with the Aliases region of the dialog, select the variable you wish to edit in the Master Variables List, change the default styles as you wish, and click Apply.
Since the XY Lines page of the Plot Options dialog enables you to choose even more customized variable styles, remember that the styles set on this page will affect the plot only if the selections on the XY Lines page are set to "Default".
|
The settings on the XY Lines page define 20 different Style Sets (selected in the Style Set menu). Tecplot RS uses the Style Sets to plot comparisons of data from multiple files (Comp 1 is used for the first comparison data set, Comp 2 for the second, and so on). If you wanted to change the color for OPR lines from green to lime, you would have to change it 20 places on the XY Lines page. The “Default” selection on the XY Lines page does defer the style settings of that compared variable to the settings on the Variables page. |
 It may seem that the settings on the XY Lines page function identically to the Default Style settings on the Variables page of the
 This section displays the path of the active RS Variables file, which contains variable name substitutions, aliases, and the default colors and line and symbol styles used in line plots. Click Change to choose a different file (sample files are provided for each simulator supported by Tecplot RS). See RS Variables Files for further information on these files.