F - 3.4 Multi-Edit XY Line Styles
The XY Lines page of the Plot Options dialog allows you to define styles for each unique variable/style set combination, one at a time. To make multiple assignments at once, click the Multi-Edit Styles button in the lower right corner of the XY Lines page. The Multi-Edit XY Line Styles dialog appears.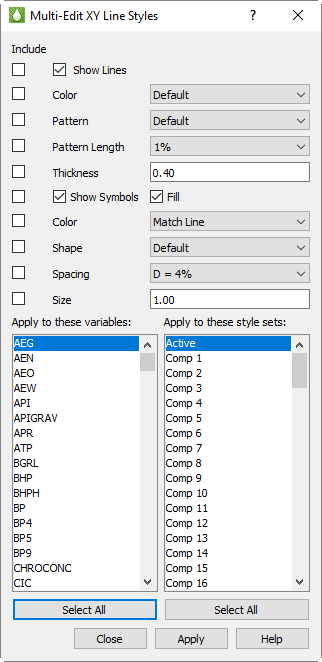
When the Multi-Edit XY Line Styles dialog opens, the selections match the settings in the Plot Options dialog, but this is just a starting point. The basic style settings are identical to those in the Plot Options dialog: line color, pattern, etc. Two things are different.
• First, you’re making style assignments to multiple variable/style set combinations. You choose the variables and style sets using the two multi-select lists in the lower half of the dialog. Most of the time, you will choose one variable and multiple style sets or one style set and multiple variables, although you can also choose one or multiple of both.
• Second, the Include toggles control which styles you are setting. You may choose to set only one style or several in a single operation.
For example, suppose you wanted to always show any Oil values in green, but alter the line style to differentiate rates from cumulative values, and use a different symbol to differentiate files in comparison plots. You can do this as follows:
1.Set the line color:
a.Check only the Include toggle next to Color, and set the color to green.
b.Highlight the desired Oil values in the variables list that will be plotted in green.
c.Highlight all the style sets using the Select All button.
d.Click Apply.
You’ve just made hundreds of changes – one per style set time the number of oil variables selected.
2.Differentiate OPR (rate) from OPC (cumulative):
a.Turn off the Include toggle next to Color, and turn on the toggle for Pattern (and Pattern Length, if desired).
b.Select the Oil Production Rate variable.
c.Choose the styles you want for Oil Production Rate—for example, a solid line.
d.Select all the style sets using Select All, then click Apply
e.Change the variable to the Oil Production Cumulative, change the line pattern to something different (e.g. short dash), and click Apply.
Repeat the last step for other oil values, using different line patterns for each.
3.Differentiate comparison plots
You may find it nice to use the line symbols for differentiating comparison plots. A character symbol is a good way to do this, and this can be done for all variables. For example:
a.Set the toggles to copy only the symbol options. You definitely want shape, but you may also want to set the size and spacing. Color is optional depending on what you want to do.
b.Choose a symbol shape of Character, and set the character to the number “1”.
c.Choose ALL variables.
d.Choose ONLY the Comp 1 style set, then hit Apply.
e.Repeat by changing the character to “2” and the style set to Comp 2.
You may choose instead to use symbols instead of line patterns to tell OPR from OPC, and use patterns to differentiate comparison plots. The choices are yours, but the Multi-Edit XY Line Styles dialog makes it easy to make mass edits.
|
|
