The Grids page in the Plot Options dialog includes selections for formatting the grid styles of active cells, inactive cells, and see-through cells. To access this page, double-click on the reservoir grid in any grid plot, or choose “Plot Options” from the Options menu and switch to the Grids page.
F - 5.1 Active Cell Grid Styles
When you have “Active Cells” selected on the left side of the Grids page, the settings that display on the Grids page control the Mesh and Contours of the active plot, for 2D Grid Plots or 3D Grid Plots.
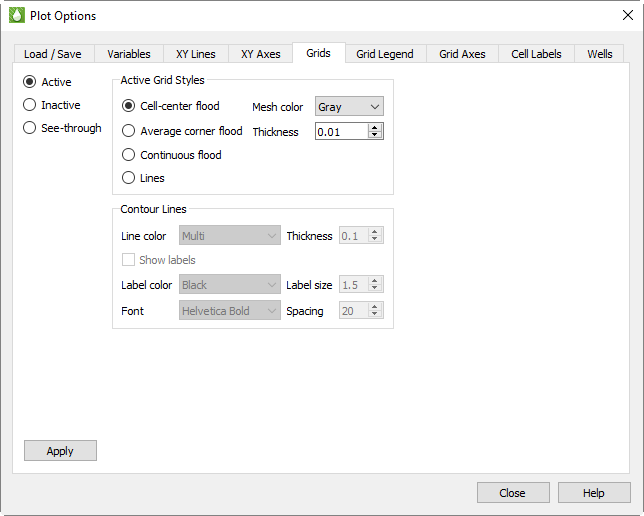
In the Active Grid Styles region of the Grid page, you can modify the color and mesh styles of the grid. The first set of options allow you to customize how Tecplot RS presents the selected grid variable on the cell faces. Choose one of the flood options to flood the cell faces with color to represent the variable value (such as oil saturation or porosity). If you choose to display contour lines, the Contour Lines region of the dialog will become active.
Your options include:
• Cell Center Flood - Tecplot RS fills the entire cell face according to the cell-center value of the selected variable.
• Average Corner Flood - Tecplot RS averages all four corners of a cell face and fills the area with a solid color. This is not useful for cell-centered data.
• Continuous Flood - Colors vary across the face according to the set contour levels. The color is constant between two contour levels.
• Lines - With this option selected, contour level values display as lines. Solid lines depict positive values and dashed lines depict negative values.
|
|

To change the grid mesh color, choose a color for the grid mesh (wire frame) from the Mesh Color menu. The “Multi” selection colors each grid line segment according to the local values of the selected grid variable.
You can choose or type a thickness of the line used to draw the mesh in the Thickness box. This control expresses thickness as a percentage of frame size, with acceptable values ranging from 0.1 to 1.0.
The Contour Lines region of the dialog controls the style settings for contour lines in the active plot, when “Lines” is selected in the Active Grid Styles region of the page. This includes the following options:
• Line Color - The Line Color menu controls the color of the contour lines. By default, Tecplot RS chooses the “Multi” value, which colors the contour lines according to the value of the contour variable. You can also choose single color options that set the contour lines to one color.
• Thickness - The Thickness box controls the width of the contour lines.
• Labels - Toggle-on “Show Labels” to include contour line labels in your plot. Use the Label Color, Label Size, and Font menus to customize the style of your contour labels. Use the Spacing menu to alter the spacing between the contour labels along a given contour line. Tecplot RS measures spacing as a percentage of the frame height.
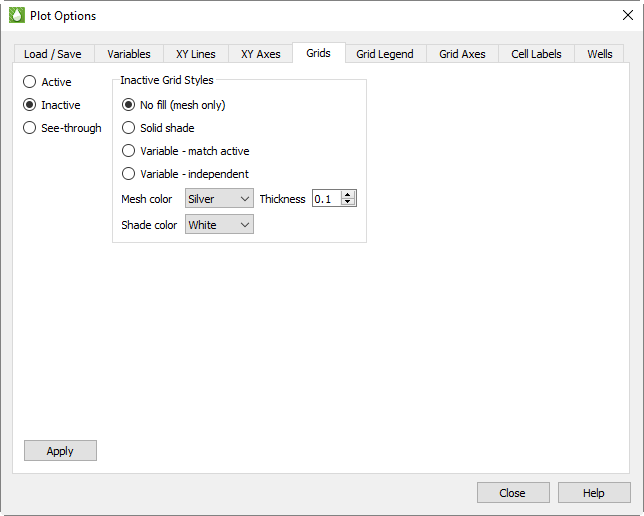
To adjust the style of the inactive cells’ display, select “Inactive” on the left side of the Grids page. With the controls that appear, you can customize the display style of the inactive cells in your grid. These controls are also included in the Inactive Cells dialog; changes made in one dialog will be reflected in the other.
In the first set of options, you can choose whether to display the inactive cells as a simple mesh or shade, or whether to display a variable value:
• No fill (mesh only) - Choose this option to display the inactive cells as a mesh.
• Solid Shade - Choose this option to fill the inactive cells with a color.
• Variable - match active - Choose this option to color the inactive cells according to the solution data of the variable used by the active cells. If the inactive cells do not contain a value for that variable, they will display with a value of zero.
• Variable - independent - Choose this option to color the inactive cells according to solution data of a variable of your choice. If the inactive cells do not contain a value for that variable, they will display with a value of zero.
To learn how to select an independent variable for the inactive cells to display, refer to Section 14 - 1.6 “Inactive Cells”.
The remaining options in the Inactive Grid Styles region of the Grids page control the mesh color, mesh thickness, and/or shading color displayed by the inactive cells:
• Mesh Color - Choose a color from the Mesh Color menu to display a mesh of that color.
• Thickness - Choose or type a thickness value between 0.1 and 2.0 in the Thickness field to specify the width of the mesh lines as a percentage of frame size.
• Shade Color - Choose a color for inactive cell shading from the Shade Color menu.
Click the Apply button to view the results in your plot.
F - 5.3 See-through Grid Styles
Tecplot RS uses see-through styles in 3D views any time you select options in which viewing the interior of the grid is advantageous, for example, when toggling-on “Ghost” while displaying Inside Views.
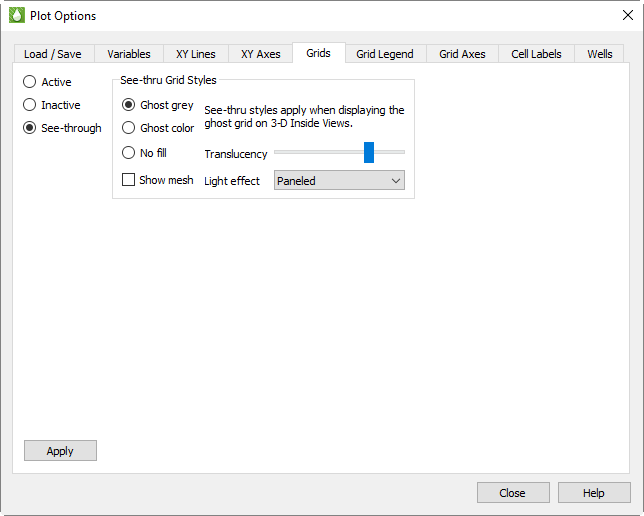
Ghost Gray is the recommended option; this will produce a translucent gray surface that shows the surface of the reservoir while also leaving the interior details visible. Use the Translucency slider to increase or decrease the visibility of the ghosted image.
The “Ghost Color” option displays a translucent reservoir surface colored by the selected grid variable.
Generally, turn off the mesh when you have either of the ghost options selected for the best view, and turn on the mesh only when No Fill is selected.
The Show Mesh option is related to, but different from, the Mesh toggle in the sidebar. The sidebar toggle turns off all mesh displays, including the mesh for the see-through grid, if it is visible. The Show Mesh option in this dialog determines whether the see-through grid’s mesh is shown when the Mesh sidebar toggle is on.
The Light Effect menu controls how light source shading is performed. This is done whenever “Light” is toggled-on in the sidebar. Choose Paneled for fastest performance, or Smooth for a more realistic (but slower) effect.