5 - 3 Custom Plot Options Dialog
To access the Custom Plot Options dialog, choose “Custom Options” from the Options menu, or click the Custom Options button in the sidebar (when available).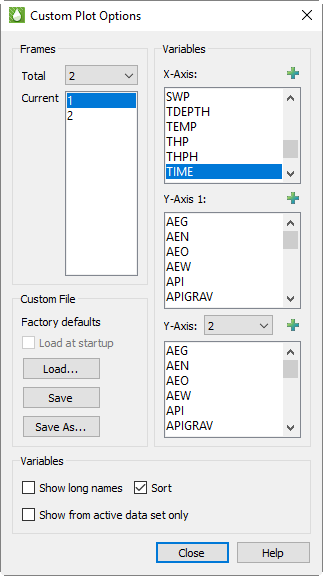
This dialog contains options similar to those in the XY Variables sidebar. It includes controls for choosing one or more variables for each axis and for creating multiple Y axes. However, the variable list does not reflect those in the current file. Only the variables found in the Master Variables list display here, as specified on the Variables page of the Plot Options dialog.
The options available in the Frames region of the dialog let you control how many frames display which entities, with the following choices:
• Total Frames Use the Total menu in the Frames region of the dialog to choose the total number of frames to plot for each entity. Each frame will contain a plot of one or more variables. This does not have to correspond to how many frames display on a single page. If you define 6 frames per entity, and set up your multi-plot options for 2 frames/page, 3 pages of plots will display for each entity.
• Current Frame To set up each frame, choose a frame number in the Current box in the Frames region of the dialog, and specify which variables to plot and on which axes with the following options:
In the Variables region at the top of the dialog, specify which variables to plot on which axes for the active frame chosen in the Frames region of the dialog. Specify the variables in the following boxes:
• X-Axis Choose a single variable for the X-axis on the active frame.
|
|
 When doing time-dependent comparisons, we recommend using DATE (rather than TIME) as the X-axis variable, because the TIME values often start at 0 but are measured from different references. Because of this, the identical time values may actually not be measured at the same physical time. You can change the default time variable (TIME or DATE) on the
 • Y-Axis 1 Choose the appropriate variable(s) from the box to coincide with the first Y-axis on the left side of the plot. Use Ctrl-click to choose multiple variables, or drag to highlight a group of variables.
• Y-Axes 2-5 When a single frame includes two or more Y-axes, choose an axis number in the menu to display the list of variables accessible for that axis. Then choose the appropriate variable(s) from the list. Use Ctrl-click to highlight multiple variables, or drag to select a group of variables.
Click the  button in any of the variable boxes to launch an expanded, searchable entity list. This helps particularly for very long lists.
Another Variables region, at the bottom of the dialog, controls the way that Tecplot RS displays variables in the X-Axis and Y-Axis boxes described previously. Use the toggles in this region of the dialog to customize the variable displays.
• Long Names Toggle-on “Long Names” to display the long variable names in the Variables lists. With “Long Names” toggled-off, Tecplot RS displays the short names.
• Sort Toggle-on “Sort” to display the variables in the boxes in alphabetical order according to their short name. With “Sort” toggled-off, variables appear as they do in the active RS Variables file. The latter method helps if you choose to use an RS Variables file to group variables in order of use.
Active The Active toggle becomes available when you have a data set loaded. With “Active” toggled-on, Tecplot RS limits the variable list to only those variables that exist in the active data set(s). In general, leave this toggled-on unless you specifically choose to edit all variables.
Use the Custom File region of the dialog to save your custom style(s) in a separate file. Custom plot definitions save with an .rscx extension (to signify their RS Custom file type).
|
|
 You can use custom files interchangeably between
 Use the following options in the Custom File region of the dialog to save and/or load style(s).
• Load Use the Load button to load existing custom option settings. Using the “Files of type” menu in the Open File dialog, you can choose to load either an existing custom file (*.rsc, *.rscx) or to extract the custom settings from an existing project file (*.rsprj). Refer to Chapter 22: “Projects” for additional information regarding project files.
• Save & Save As Use the Save and Save As buttons to save your custom options settings to a file. Toggle-on “Load at startup” after saving your settings to load the current settings every time Tecplot RS starts. You may wish to save your custom options if you intend to record macros for custom plots, because when recording macros, the macro does not save the steps to create a custom plot definition. Save your selections to an .rsc file in order for the macro to replay correctly.
|
|
 If you would like to associate a custom file with a given XY data file or files, we recommend creating a project file for these files. Refer to