Contour plots can be used to show the variation of one variable across the data field. To add a contour layer to your plot, toggle-on "Contour" in the Plot sidebar.
|
|
 Contour plots can only be plotted with organized data, such as IJ-ordered, IJK-ordered, or FE-data. Refer to
 Additional options can be set on the Contour & Multi-Coloring Details (accessed via  to the right of Contour in the Plot sidebar or Plot>Contour/Multi-Coloring) and the Contour page of the Zone Style dialog.
An example of each contour plot type is shown in Figure 9-1.
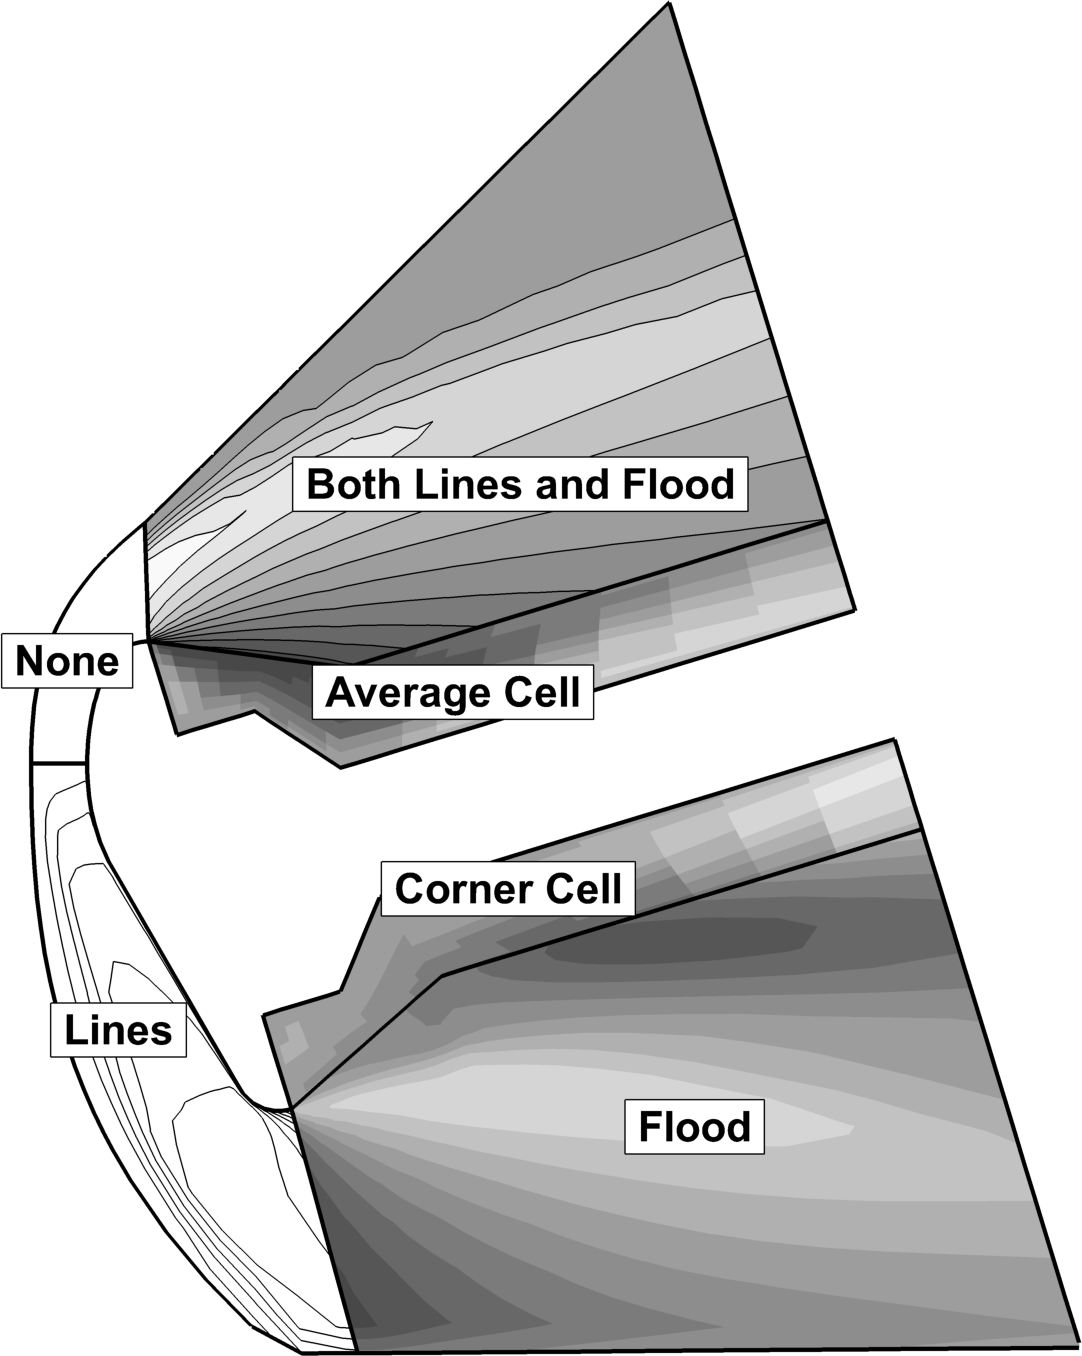
Figure 9-1. Contour plot types.
|
|
 Contour plots for streamtraces, iso-surfaces, and slices are controlled by their respective details dialogs and are not discussed here. (Refer to