7 - 3 User Groups, Well Patterns, and Branches
Simulator output often includes cumulative quantities for the entire field and one or more groups of wells. Different simulators may classify these as separate entity types under the heading of groups, areas, or regions. Tecplot RS saves each set of cumulative values as an individual entity that can be plotted, and also allows you to interactively create similar cumulative quantities with the Groups/Patterns/Branches dialog.
7 - 3.1 An Overview: Using Groups, Patterns, and Branches
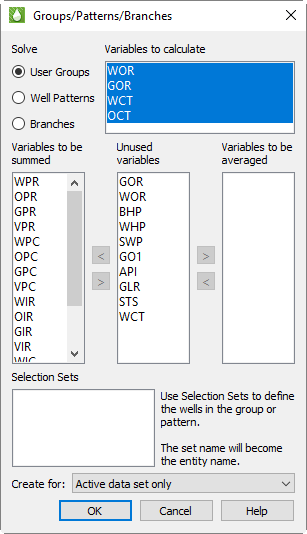
Use the Groups/Patterns/Branches dialog (accessible by choosing “Groups/Patterns/Branches” from the Data menu) to set up user groups, well patterns, or branches.
The User Groups controls allow you to create your own new entities in which Tecplot RS calculates the variable values from two or more wells. You can choose which variables to include and whether to calculate them by summing or averaging the individual well values, or as ratios computed from summed or averaged results. Tecplot RS adds these new entities and variables to the sidebar entities list, from which you can plot them using various XY plot types.
If you have loaded Well Allocation Factor Data Files into your project, you can create well pattern groups using the Well Patterns controls. With these controls, as with User Groups, you can create new entities that include variable values from one or more well.
Unlike user groups, however, well patterns use WAF data to apply a weighting factor to each variable value, and can reflect changes in WAF values over time.
Once created, you can view well pattern entities using the XY Subsets plot type. In this plot type, the total value for the pattern appears along with the contribution of each producer and injector pair.
You can also view well pattern entities in standard XY plots (XY Variables, XY Entities), but to do this you must first click the Filter button and use the Filtering dialog to select the Well Pattern entity type for display in the entities pane of the sidebar.
With the Branch controls, you can create summation or average values for all of the segments in each branch of a multi-segmented multilateral well. You can use branches with Eclipse data files that contain segment information. Two or more segments combined make up a branch, and multiple branches make up a well. You can plot the created branches using various XY plot types.
7 - 3.2 Preparing to Use Groups, Patterns, and Branches
User groups, well patterns, and branches require a couple set-up steps before you can use the Groups/Patterns/Branches dialog to create them. Follow the instructions in this section for the entity you wish to create.
To create a user group, you must first define one or more Selection Sets. In the selection set, specify which wells you wish to combine. Use only well entity types to create user groups – Tecplot RS will ignore other types (field, RFT data, block data, and so forth).
Tecplot RS will use the selection set name as the user group name, so name the selection set accordingly. To make the selection sets and user groups reusable, save your selection sets in a permanent file (refer to Section 7 - 2 “Selection Sets”).
Created selection sets display at the bottom of the Groups/Patterns/Branches dialog.
As with user groups, well patterns require definition of one or more Selection Sets. Specify which wells you wish to combine; for well patterns, the selection set must contain at least one injector well in addition to producer wells. Including at least one injector well enables Tecplot RS to determine which factors to use in its calculations.
You do not have to specify every injector-producer pair that you wish to include in the selection set; just include all the injectors and producers that you wish, and Tecplot RS will use the WAF data to find each pair of injectors and producers that influence each other.
To create branch information, you must have both the XY (unsmry) and grid restart (unrst) files loaded into Tecplot RS, as well as the XY data file as the active data set (refer to Section 4 - 2 “Managing XY Data” for more information). The Segment data will load as part of the XY data. (You must instruct the simulator to include the segment information in the output file).
The restart file includes information that identifies to which branch a particular segment belongs. You must identify the restart file in the box at the bottom of the Groups/Patterns/Branches dialog. If you already have the restart file loaded into Tecplot RS, Tecplot RS will automatically include the file name.
7 - 3.3 New Entities: Creating User Groups, Patterns, and Branches
Once you have created your selection sets (for user groups or patterns) or restart file (for branches), you can begin creating a new entity. From the menu bar, choose “Groups/Patterns/Branches” in the Data menu to open the Groups/Patterns/Branches dialog.
The variables associated with the current well entity type display in the Vars to Calculate box. By default, the Vars to be summed box includes all the identifiable production rate, injection rate, and cumulative values, and the Unused variables box includes all remaining values.
Variables to Calculate
The Vars to calculate box includes four items. Tecplot RS calculates these values after it has summed or averaged all the others, since these variables depend on other values included in the calculations:
|
Acronym |
Definition |
Formula |
|
WOR |
Water / Oil Ratio |
WPR / OPR |
|
GOR |
Gas / Oil Ratio |
GPR / OPR |
|
WCT |
Water Cut |
100 * WPR / (WPR + OPR) |
|
OCT |
Oil Cut |
100 * OPR / (WPR + OPR) |
In the User Groups controls, by default, all four values appear selected for calculation.
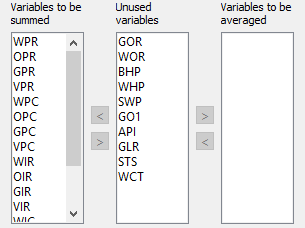
Variables to be Summed, Unused, or Averaged
To adjust which variables Tecplot RS sums or averages, highlight the variables you wish to move in one of the three adjacent variable boxes and use the Move ( > and < ) buttons to transfer the highlighted variables to the box right or left of the Move button. For example, if you do not want to include VPR and VPC values in your user group summation entities, highlight those names in the Vars to be summed box and click Move (>) to move them to the Unused variables box. In addition, if you decide to average some of the pressure data, highlight BHP, WHP, and SWP in the Unused variables box and click Move (>) to move them to the Vars to be averaged box.
 The well patterns controls allow only summation, not averaging, since well patterns already represent the WAF-weighted sum of variables. However, you will need to indicate which variables are rate values and which are cumulative values, as these must be summed in different ways. To do this, move each rate or cumulative variable to the Rate Variables or Cumulative Variables box using the Move (> and <) buttons.
Create User Groups for Active or All Data Sets
Before you create a new user group, you can choose whether to create the group for only the active data set or for all loaded data sets. To set this option, use the Create for menu that appears at the bottom of the Groups/Patterns/Branches dialog, with User Groups chosen as the entity for which to solve.
User Group, Well Pattern, and Branch Creation
To create new user groups, well patterns, or branches, choose the variable settings you wish to include, choose whether to create the user group for the active data set only or all data sets (if creating a user group), and click OK. The dialog will close, and the calculation’s progress will display in the status bar at the bottom of the Tecplot RS workspace. Once Tecplot RS has completed the calculations, it will add the new entity names and variables to the entity list in the sidebar, and you can begin plotting the results.
Tecplot RS prefaces well patterns with “WP:” followed by the selection set name, to differentiate them from user groups or branches created with the same selection set. Tecplot RS uses “B-” followed by the selection set name to indicate a branch entity, to distinguish it from the wells and completions of the same name.
|
|
 When you create user groups, your selections REPLACE any existing user group entities. You cannot add a single new user group to those created earlier. In general, most of the work to build user groups is in the creation of the selection sets, and the actual solution is done in a single operation.
7 - 3.4 Saving and Automating User Groups and Well Patterns
When you save or update your project file after creating a user group, Tecplot RS will save the created user group(s) in the project.
However, Tecplot RS does not save well patterns automatically. You can access them as long as you work in the same session of Tecplot RS, but once you close your session, you lose any created well pattern(s). To avoid having to create well patterns repetitively every time you want to use them, use a simple macro to automate recreating them.
To create this macro:
1.Save the current state of Tecplot RS to a project file, if you have not done so already.
2.Choose “Record Macro” from the Macro menu.
3.Assign a name and location for the macro file. We recommend a name that matches the root name of the file containing the XY data, but this is not a requirement.
4.With the macro recording, open (or re-open) the project file.
5.Create the well pattern(s).
6.Finish the macro file by clicking Stop Recording in the Macro Recorder dialog.
Now you have a small macro that will open all the files associated with your reservoir AND create the well pattern(s). The next time you want to work with this data, instead of loading data from the Project menu, click the Play Macro button in the toolbar or choose “Play Macro” from the Macro menu. Choose and play the macro that you created, and the macro will open all your files, complete with solved well patterns.