You can display wells on both 2D Grid Plots and 3D Grid Plots. Use the Wells page to control well symbols colors, sizes, and labeling options. To access the Wells page of the Plot Options dialog quickly, double-click on a well head symbol. Holding down the Ctrl key and double-clicking your pointer will interactively select an individual well.
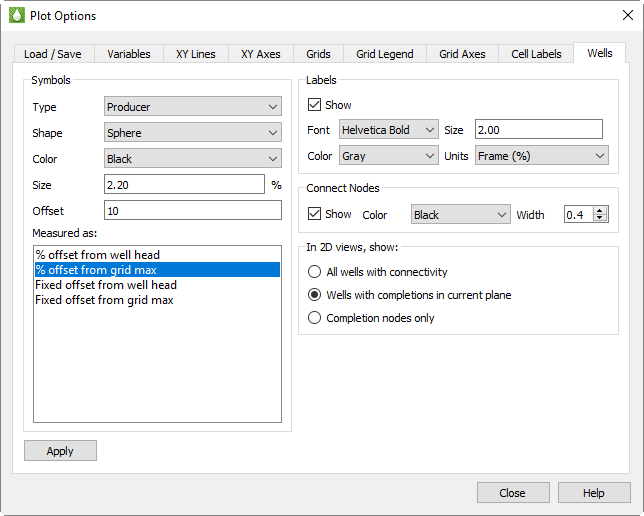
In the Symbols region of the page, you can customize how well symbols appear, as well as where well symbols display relative to their well. Four selections control how well symbols appear on the grid plots.
There are actually seven sets of well symbol settings, one for each of the Types in the first option menu.
The well types are read from the simulator files. Tecplot RS recognizes five basic types, including:
• Producer
• Gas Injector
• Water Injector
• Injector (“generic”, or anything other than gas or water)
• Shut-In
You can select a different symbol / color / size for each type. These will be placed on the well head. Symbols are also placed on the well nodes (completions), and these are categorized as either Open or Closed.
For each of the listed types, you can choose the color, shape, and size. Sizes are expressed as a percentage of the frame size.
The selections for the symbol shape include:
Square Circle Diamond
Delta Gradient Left Triangle
Right Triangle Cube Sphere
Octahedron
The last three shapes (cube, sphere, and octahedron) are 3D symbols. In 2D Grid plots, they will be shown as squares, circles, and diamonds, respectively.
The simulator output files describe the well geometry by designating the cells containing the well completions. The well head (or first node) is located within the grid, usually (but not always) in the first K plane. When Tecplot RS plots wells, it places the well head symbol in a position above the surface of the grid model so it is easily visible in both 2D and 3D views.
You have control over how this position is determined with a pair of controls in the Symbols region of the Wells page. The Well symb offset box contains four options. Use these options to select the point from which to measure the offset (from the first completion or from the highest elevation in the grid model), and the units for the offset (an actual distance or a percentage of the grid height). You can then use the Well symb offset text field to specify the actual percentage or distance.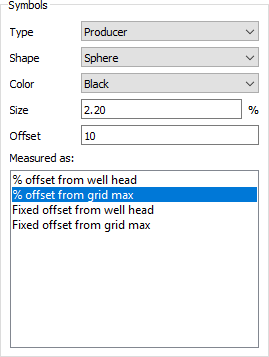
When the offset is measured from the well head, the symbols generally follow the surface of the grid model. However, sometimes the well head or first completion falls in a cell significantly beneath the grid surface, causing the symbol to be hidden within the grid within 3D Views. In this case, you can designate that the starting point for the offset be the maximum elevation in the grid model. This guarantees that the symbols will all display visibly, but it also means that they will be at a constant height, possibly increasing the likelihood of interference.
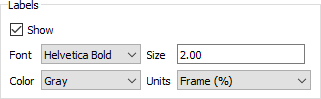
The Labels region of the Wells page controls how to display well labels. A “Show” toggle controls whether to include labels for the well names
.
You can choose the font and color of the labels from the Font and Color menus in the Labels region of the Wells page.
To change the label size, type a value in the Size text field. The Units menu controls whether the size is expressed as a percentage of the frame size (the labels remain the same size when you zoom in) or a percentage of the grid area (when you zoom in, the labels get larger along with the image).
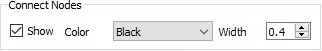
Use the Connect Nodes region of the Wells page to specify the style of the line that is drawn between well nodes to represent the well path. The Connect toggle in the upper portion of the sidebar controls the display of these lines.
Use the 2D View settings region of the Wells page to specify how to treat wells in 2D Grid plots.
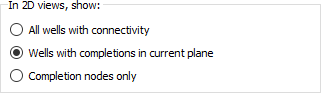
Choose from one of the following options:
• All wells with connectivity Select this option to draw all wells and display the connectivity between completions and well heads.
• Wells with completions in current plane Select this option to draw only wells with completions in the current plane.
• Completion nodes only Select this option to display only the completion nodes in the current plane. The well path will not display.