The settings on the XY Axes page of the Plot Options dialog control the axis ranges for each variable as well as the style of the axes on all XY plots. To quickly access this page, double-click on an axis or axis label (title) in any XY plot.
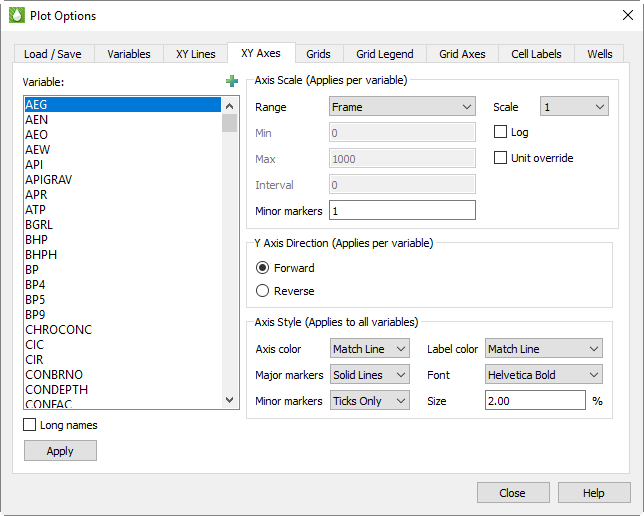
Use the Variables list on the left of the dialog to choose a variable to customize. If you access this page by double-clicking an axis or label in your XY plot, the dialog will open with the variable assigned to that axis highlighted in the list. Click the  button in the upper-right corner of the list to launch an expanded, searchable variables list. This button helps particularly for very long lists.
The Long Names toggle controls whether the Variables box displays the long variable names. Toggle-on “Long Names” to display the long variable names. Otherwise, the short (acronym) names display.
The list of variables that displays here comes from Section F - 2.1 “Master Variables List”.
You can also switch to the Variables page of the Plot Options dialog and manage this list of variables by sorting it alphabetically and limiting it to just the variables that appear in your data files. You can use the Variables page to add variables to your RS Variables file.
The Axis Scale region of the dialog controls the scale (range and display) of axes on XY plots. You can choose to instruct Tecplot RS to display a range that fits the data, or to customize the ranges manually.
The selections in the Axis Scale region of the dialog apply only to the variable selected in the Variable list. After clicking the variable in the Variable list that you wish to customize, choose from the following options in the Axis Scale region of the dialog.
• Range - The Range menu controls how the minimum and maximum axis values are determined. Choose from three options:
• Frame - With this option selected, Tecplot RS will compute the limits to encompass the range of variable values plotted in a single frame. This option gives you the best “zoomed in” view of the data.
• Data - If “Data” is selected, Tecplot RS will compute the limits to encompass the range for each variable in all entities of the same type. This gives a common scale for all frames, to show how one well compares to another.
• Manual - Choose this option to manually type the minimum and maximum values for Tecplot RS to use for axes.
|
|
 For the majority of applications, setting the range to either Frame or Data will produce good results.
• Min and Max - These text fields become active when you select “Manual” for the range. Type the minimum and maximum values of the range in these boxes. If you wish to adjust the range of your Time or Date variable, type the Min and/or Max in the decimal year format (for the Date variable; for example, 2000.50) or the decimal days format (for the Time variable; for example, 40.75).
• Interval - Choose the interval of units display between major markers (labels). A value of zero (0) instructs Tecplot RS to calculate the interval.
• # of Minor Markers - Choose the number of minor markers or grid lines to display between major markers. Use 0 to skip drawing minor markers.
• Scale - The Scale menu rescales axes labels. When you deal with very large values, you can direct Tecplot RS to reduce them to multiples of a thousand, million, and so forth by choosing a factor from this menu. Choose “Enter” to type a custom scaling factor in the text field beneath the Scale menu.
When you use a factor other than 1, the axis label will include the scaling information. For example, when the Oil Prod Rate variable Scale is set to 1000, the label reads “Oil Prod Rate (1000 STB/Day)”.
• Toggle-on “Log” to use a logarithmic scale. In this case, it is usually best to select Manual range with “nice” values for the limits (such as 1, 10, 100, and so forth).
• Unit Override - Toggle-on “Unit Override” to specify your own unit label. The standard unit label is a combination of the scale factor and the unit label from the data file. After toggling-on “Unit Override”, type the unit label that you wish to display in the text field that appears underneath the Unit Override toggle. For example, you might type “MSTB/Day” to replace “1000 STB/Day”.
|
|
Choose the Y axis direction for this variable in XY plot types.
|
|

The selections in the Axes Style region of the XY Axes page control how axes are drawn and labeled:
• Label or Axis Color - Choose the color of the displayed label or axis:
• Standard Colors - Choose from 26 standard colors.
• Match Line - Choose Match Line to match the color the text, axes, and/or grid and markers according to color of Axis Line Variable. When comparing data sets, Tecplot RS matches the color of the variable in the active data set. When multiple variables are plotted on a single axis, Tecplot RS uses the color of the first variable.
• Font - Choose from a list of the available fonts.
• Size - Choose the font size expressed as a percentage of frame height.
• Major Markers - Choose Ticks, Solid Lines, Dotted Lines, or Precise Dots.
• Minor Markers - Choose from the same options as for Major Markers (above).
Tecplot RS will apply the selections on this page as follows:
• Axes are always drawn with major markers and a border.
• Tecplot RS will use the same font for axes labels and the axes titles.
• If you specify an axis size in the dialog, the axes labels will also use this size. The titles will be 1.2 times as large as the specified axis size.
• The choices you make for major and minor markers will apply to both axes.
• Label size and color selections are used on all axes.
• Tecplot RS controls the plotting area within the frame, making adjustments according to how many axes are displayed and the selected font sizes. For multi-frame plots, Tecplot RS rescales the font size based on the aspect ratio of the frames.
Tecplot RS will choose a labeling interval automatically.