Geological faults are represented inside Tecplot RS as cell faces that will be flooded by the variable value from the cell they are attached to. They can be defined in three ways:
• They can be loaded along with the grid. With the Sensor and VDB simulators, the fault data is included in the grid data file. With CHEARS and Eclipse, the fault data is a separate ASCII file (with a .faults filename extension) included with the input deck; if it has the same base name as the grid file, it will be loaded automatically. Faults loaded along with the grid will have names or numbers and will be referred to as “named faults.”
•  Non-Neighbor Connections (NNCs) included in the grid data can be used to define fault faces. Tecplot RS also has a separate Inside View for NNCs (see “NNCs” on page 189). The difference is that the NNCs view colors the faces based on the value of a specific NNC variable; the Faults view colors them based on the grid variable.
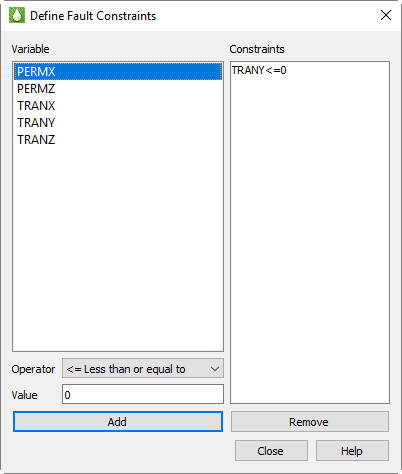
• Faults may be defined by constraints, which define a variable and condition that identifies the fault cells, for example, TRANX <= 0. (The X in the variable name indicates the face used for the fault.) The Define Fault Constraints dialog (shown here) is launched by clicking the Constraints button in the sidebar when the Faults Inside View is active or by choosing Data > Fault Constraints from the menu.
Fault constraints are saved with project files; be sure to save a project file if you wish to save your constraints.
To define a new constraint:
• Highlight the variable in the list, which displays all static variables whose names begin or end with I, J, K, X, Y, or Z. These may be further decorated with + or - to indicate the upper or lower face.
• Choose an operator, such as “<=” for “less than or equal to.
• Click Add.
You may click unwanted constraints in the list and click Remove to remove them.
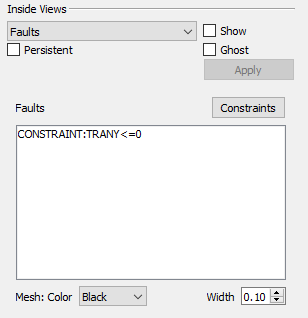 Regardless of how your constraints are defined or loaded, they appear in the Faults list in the Inside Views section of the sidebar. Named constraints, NNCs, and constraints are all listed and may be toggled on and off independently. Click any listed fault to select only that fault; hold Shift while clicking again to select a range of the listed faults. Hold Control while clicking to toggle individual faults on and off. You may also choose the mesh color and the width.
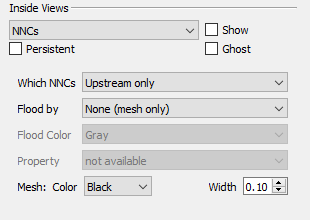 If your grid model includes Non-Neighbor Connections (NNCs), you can view them by choosing NNCs in the drop-down menu of the Inside Views section of the sidebar. (For NNCs in 2D Grid plots, see “NNCs (2D Grid plots)” on page 170.) The Inside Views section of the sidebar then shows controls for choosing which NNCs are displayed and specifying how they will appear.
You can choose to display the upstream faces, downstream faces, or both. When both types are displayed, the overlap can cause interference.
The faces may be flooded with no color (displaying only the mesh), a solid color, or contoured based on a selected NNC variable, if your data includes such variables. You may also choose the mesh color and width.
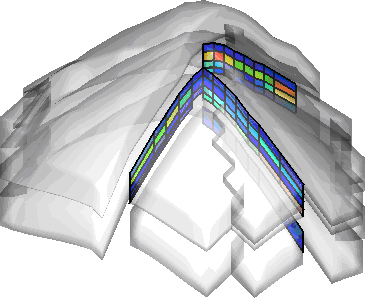
To make the NNC faces visible, Tecplot RS activates see-through grids when NNCs are displayed. Use the Grids page of the Plot Options dialog (accessible on the Options menu) to customize the See-Through Styles.
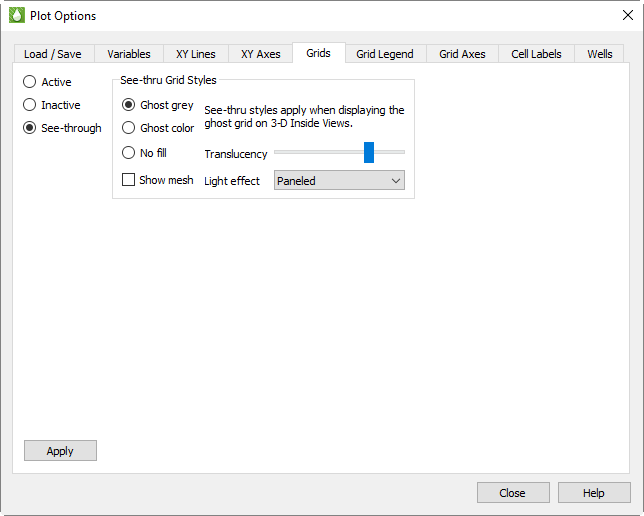
When the See-Through Style is set to “Ghost Gray”, you can use the Light Effect to alter the appearance of the surface. Choose the “Paneled” Light Effect to get a better idea of cell boundaries (especially when the mesh is turned off), or “Smooth” to create a more rounded look. The “Smooth” option may render slowly on very large models.
Only NNCs within a grid are displayed. NNCs between the global grid and LGRs, or those between two LGRs, are not highlighted, although the boundaries are still visible when translucency is on.
When NNCs are displayed, Tecplot RS displays a legend for the NNC variable. You can move or remove this legend by choosing the Paper Layout plot type and moving or deleting the RS_NNCVAR (the legend title) and/or RS_NNCLEGEND (the legend itself) dynamic text items from the layout.
To adjust the legend, double-click it. The Grid Legend page of the Plot Options dialog appears; click the variable by which the NNCs are colored in the Variables list to modify the NNC legend settings.
Tecplot RS will display streamline data as an Inside View, providing a look at how fluids move through the reservoir model over time.
Streamline data are stored in separate files. Load streamline data on the File(s) page of the Load Grid Data dialog under the Streamlines heading. Tecplot RS will accept streamlines provided by a simulator that output streamline data in the FrontSim .slnspec format.
|
|

Tecplot RS displays a streamline legend when streamlines are active. To move or remove this legend, switch to the Paper Layout plot type and move or delete RS_STREAMVAR (the legend title) or RS_STREAMLEGEND (the legend itself).
To adjust the legend, switch to the 3D Grid plot type and double-click the legend. The Grid Legend page of the Plot Options dialog appears; click the variable by which the streamlines are colored in the Variables list to modify the streamline legend settings.