A line plot is the simplest type of graph you can produce with Tecplot 360 EX. A typical line plot includes a dependent variable (usually the vertical axis for XY plots) and an independent variable (usually the horizontal axis for XY plots). Each line on the line plot represents one series of data points, where each data point is defined by its independent and dependent variable values. A series of data points is referred to as a mapping (or map, for short).
Tecplot 360 EX supports two types of line plots, XY plots and Polar plots. XY plots are plotted on Cartesian coordinates using X & Y as the independent and dependent variables (See Section 17 - 2 “Axis Variable Assignment”). XY plots can include line, symbols, bar and/or error bar layers. Polar plots are plotted on polar coordinates using Theta and R values. Polar plots can include line and/or symbol layers.
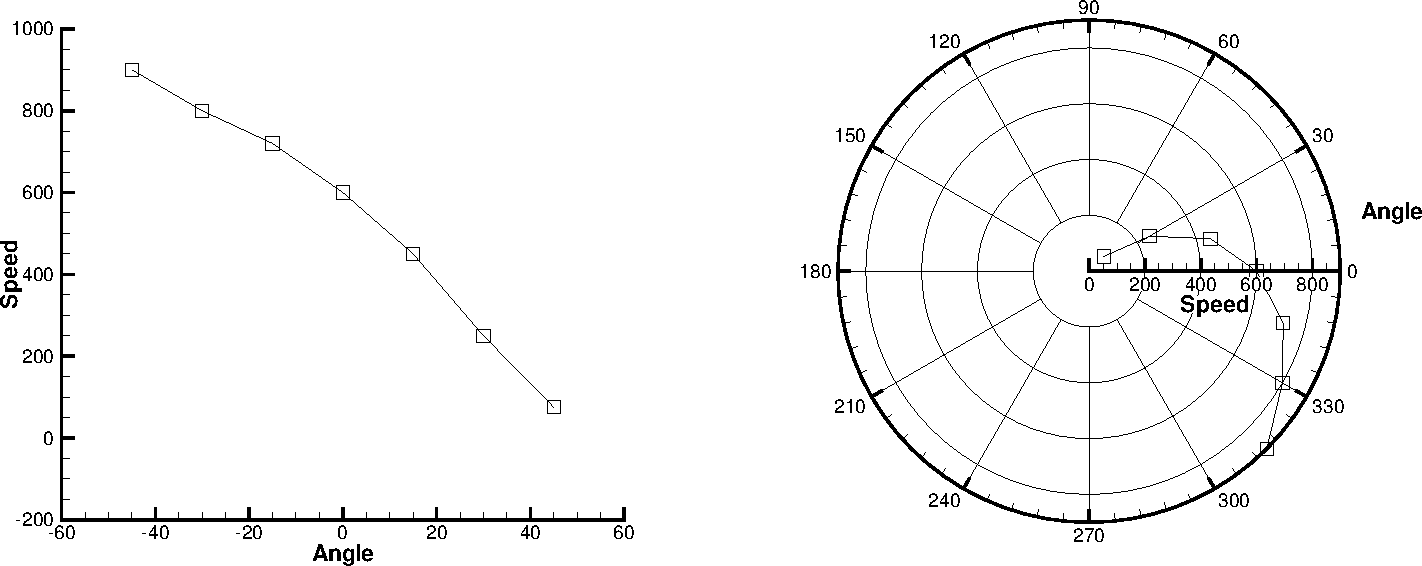
An example of XY and Polar Line plots is shown below.
Line plots are usually created from one-dimensional, I-ordered data. The data used for line plots must have at least two variables defined at each data point. The same number of variables must be defined at each data point.
You can also create line plots from two or three-dimensional data in the IJ or IJK-ordered structure, or from finite element data by selecting "XY Line" from the plot type menu in the Plot sidebar. If "XY Line" is selected, finite element data sets will be treated as I-ordered (the connectivity list is ignored), IJ-ordered datasets will be treated as a family of J-sets of I-ordered data, and IJK-ordered datasets will be treated as K-planes of J-families of lines. Use the Indices page of the Mapping Style dialog to select different ranges and skip intervals for the I, J, and K-indices. See Section 6 - 6 “I, J, and K-indices” later in this chapter for more information.
When you first create a line plot, the Create Mappings dialog appears automatically so you can choose the mappings to be created (see Mapping Creation). Names, colors, symbol types, and line patterns are automatically assigned to each mapping. These and other line plot attributes can be changed using the pages of the Mapping Style dialog. To bring up the Mapping Style dialog, go to the Plot menu and select "Mapping Style", or select the [Mapping Style] button on the Plot sidebar.