To define a new mapping, select the [Create Map] button in Mapping Style dialog. The dialog also appears automatically the first time you choose the XY Line or Polar Line plot type. As shown below, the dialog is slightly different for the two plot types.
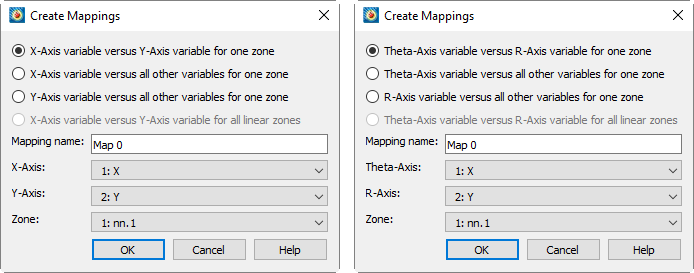
In XY Line plots, you have the following options:
• X-axis Variable versus Y-axis Variable for One Zone (default) - Add a single mapping with one X and one Y-variable for one zone.
• X-axis Variable versus All Other Variables for One Zone - Create a new set of mappings using one variable as the X-variable and each of the other variables in the zone as Y-variables.
• Y-axis Var versus All Other Variables for One Zone - Create a new set of mappings using one variable as the Y-variable and each of the other variables in the zone as X-variables.
• X-axis Variable versus Y-axis Variable for All Linear Zones - Define one map for each zone, with the specified X-axis and Y-axis variables. If you choose this option, you specify only the X-axis and Y-axis variables.
The options for polar line plots are the same as above, but with respect to the Theta-axis and R-axis variables.
Specify the mapping name and the axis variables in the bottom section of the dialog. The default name is "Map n," where n is the number of the mapping to be created. If you are creating a mapping for one zone, you also select the zone here.
When you first load an ordered dataset, some mappings are automatically created for you. If your dataset has more than two variables, mappings are created that associate the first variable with each of the other variables for the first zone only.
|
|
 Selecting variables in a 3D finite element zone may require significant time, since the variable must be loaded over the entire zone. XY and Polar line plots are best used with linear or ordered data, or with two-dimensional finite element data. The defaults used in the Create Mappings dialog favor the types of zones that yield good performance.