You can generate a legend that shows the line and symbol attributes of the mappings. In XY Line plots, this legend includes the bar chart information. The legend can be positioned anywhere within the line plot frame.
The mappings that are shown in the legend are selected on the Definitions page of the Mapping Style dialog. By default, all mappings are shown, but Tecplot 360 EX removes redundant entries.
To include the line plot legend, open the Line Legend dialog (accessed via the Plot menu) and toggle-on "Show Line Legend".
The Line Legend dialog has the following additional options:
• 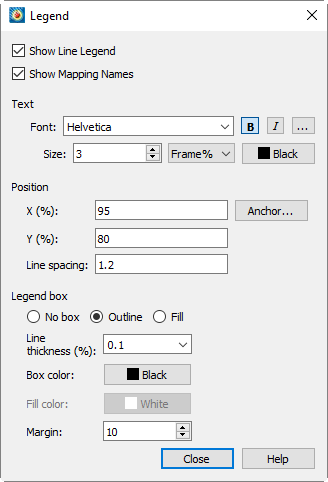 Show Mapping Names - Toggle-on or off to include mapping names in the legend.
• Text - Format the text for the legend by choosing a color, font, and size. (See Font Folders and Fallback for more information on how fonts work with Tecplot 360 EX.)
• Position - The legend is automatically placed for you. You may specify the position of the legend by entering values in the X (%) and Y (%) text fields. Enter X as a percentage of the frame width and Y as a percentage of the frame height.
• Line Spacing - Spacing between items in the legend as a multiple of the font size.
• Anchor - You may also specify the anchor location of the legend using the Anchor Alignment dialog. By default, the legend is anchored in the top right.
• Legend Box - Choose No box, Outline, or Fill mode. If the legend box mode is Outline or Fill, the box attributes may be changed with the following controls:
• Line Thickness - Specify the line thickness as a percentage of frame height.
• Box Color - Choose a color for the legend box outline.
• Fill Color - Choose a color for the legend box fill (Fill mode only).
• Margin - Specify the margin between the legend text and legend box as a percentage of the text height.