Field plots are 2D Cartesian or 3D Cartesian plots. The axes in a field plot are all independent variables. In Tecplot 360 EX, field plots can be created using any combination of the following zone layers:
By default, 2D and 3D field plots are initially displayed with Mesh and Edge zone layers (Figure 7-1).
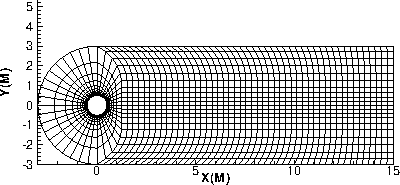
Figure 7-1. A 2D mesh and edge plot.
3D field plots may be enhanced with lighting effects and translucency (see Chapter 13: “Translucency and Lighting”).
|
|
 Bounding boxes are displayed in 3D plots for volume-only zones when the plot contains only such zones and the zones themselves are not otherwise visible due to having no style. These bounding boxes may be turned off in the Options menu.
Field plots may also contain any combination of the following objects (which are derived from the values in the dataset):
• Iso-surfaces (3D only)
• Slices (3D only)
This chapter discusses the plot attributes that are common to all of the plot layers.