To include a contour legend, select the Legend page of the Contour & Multi-Coloring Details dialog for the appropriate contour group.
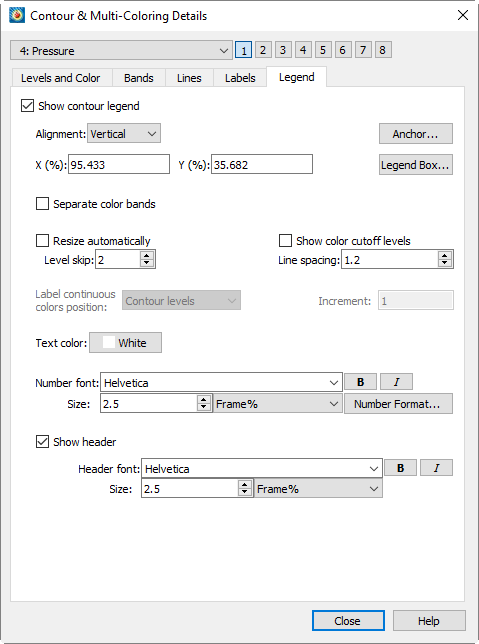
Use the [1], [2], [3], [4], [5], [6], [7], and [8] buttons to specify attributes for a specific contour group. Each contour group has its own settings for the contour attributes established in the Contour Details dialog. Refer to Contour Groups for additional information.
The following options are available:
• Show Contour Legend - Select this option to show the contour legend on your plot.
• Alignment - Select Vertical or Horizontal.
• Anchor - Specify which part of the legend is anchored in the selected position using the Anchor Alignment dialog.
• Position - X (%) and Y (%) as percentages of the frame width and height. (You can also move the legend interactively.)
• Legend Box - Displays the Legend Box dialog to adjust the appearance of the box around the legend, or turn it off entirely.
• Separate Color Bands - Select this check box to separate the color bands in the legend with black lines. Use this option to visually separate similar colors. If this box is not selected, similar adjacent colors may tend to blur together.
• Resize Automatically - Automatically skips some levels to create a reasonably sized legend.
• Include Color Cutoff Levels - Color bands and labels for levels affected by Color Cutoff are shown in the legend.
• Label Continuous Colors Position - If you have selected "Continuous Color Distribution" on the Levels and Color page of the Contour Details dialog, you have three options for placement of labels on the legend:
• Contour Levels - This option places one label for each contour level. See Section 9 - 2.2 “Contour Levels and Color”.
• Specified Increment - Enter a value in the Increment text field.
• Color Map Divisions - Places one label for each control point on the color map.
• Level Skip - Enter the number of levels between numbers on the legend. This also affects the number of levels between contour labels on the plot. Skipping levels on the contour legend compresses the color bar (if one appears); it does not change the spacing between text entries on the legend.
• Line Spacing - Enter the spacing between contour legend numbers. This does not change the number of entries in the legend, so a large value here creates a large legend. Use Level Skip to reduce the number of entries in the legend.
• Text Color - Affects the color of all text in the legend.
• Number Format - Adjust the format of numbers in the legend. See Section 6 - 7.2 “Specify Number Format” for more details on numeric formatting
• Number font - Choose the font used for numbers in the legend, including size and variety (boldface or italic). See Section 18 - 1.2 “Font Folders and Fallback” for more information on how fonts work with Tecplot 360 EX.
• Show Header - Toggle-on to include the name of the contour variable in the legend.
• Header Format - Adjust the font and height for the legend header or the legend labels, including font size and variety (boldface or italic). (See Section 18 - 1.2 “Font Folders and Fallback” for more information on how fonts work with Tecplot 360 EX.)
|
|
 Not all fonts have Bold and/or Italic variants. For fonts that do not have these styles, the