21 - 11 Extracting Fluid Flow Features
Tecplot 360 EX can display important features in 3D fluid flow solutions that make analyzing the solutions much easier. For trans-sonic flow, it can display shock surfaces. For all flows, including incompressible flows, it can display lines indicating the location of vortex cores, as well as separation and attachment lines. These calculations make use of MIT's FX library. These features are accessed through the Extract Flow Features dialog.
The Extract Flow Features dialog is displayed by selecting Extract Flow Features from the Analyze menu.
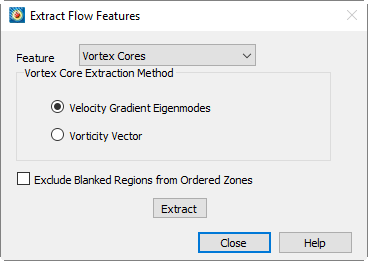
It contains a drop-down for selecting the desired feature, options for specifying the algorithm to use when extracting vortex cores, as well as an [Extract] button, which performs the desired task.
Flow features are identified using field variables you have identified on the Field Variables dialog. (See Section 21 - 3 “Identifying Field Variables”) and may be affected by settings on the Fluid Properties dialog. (See Section 21 - 1 “Specifying Fluid Properties”) The feature extraction may also be affected by your boundary settings. In particular, separation and attachment lines are only calculated on boundaries you have identified as wall boundaries. Refer to Section 21 - 4 “Setting Geometry and Boundary Options” for more information on specifying boundary conditions for your data.
21 - 11.1 Extracting Shock Surfaces
To extract shock surfaces, select Shock Surfaces from the Feature drop-down, then click Extract. The remaining controls on the dialog are disabled. After calculation, shock surfaces are then displayed as iso-surfaces of a new dataset variable named ShockFeature. This variable is similar to the Shock variable available on the Calculate dialog.
|
|
 Shock Surface values are calculated for the current time step only. The ShockFeature variable will equal zero for all other time steps.
You may note that the displayed shock surface is obscured by clutter due to the sensitivity of the shock function capturing minor oscillations in the solution. A useful technique for displaying only the true shock is to use the value blanking feature to eliminate regions where this clutter appears. Use Tecplot 360 EX's Calculate dialog to calculate the Pressure Gradient Magnitude variable, then use the value blanking to blank the plot where this variable is less than some constant. A good value to use is  , or for PLOT3D non-dimensional data, just 0.1.
21 - 11.2 Extracting Vortex Cores
To extract vortex cores, select Vortex Cores from the Feature drop-down, choose from the two available extraction methods, then click Extract. The cores consist of a group of line segments that may not all be connected. As a result, they are displayed using a line segment finite element zone. Display the Mesh or Edge plot layer to see the new zone. NOTE: the new vortex core zone is a static zone.
If you are using value blanking, you may need to interpolate the blanking variable to the new zone. Refer to Section 20 - 9 “Data Interpolation” for information on interpolation and Section 19 - 1 “Value Blanking” for information on value blanking.
Due to the properties of the algorithm used, vortices that happen to exactly align with grid lines may not be properly extracted. This is unlikely to occur in real-world solutions, but is common in test data generated by extruding 2D solutions to produce artificial 3D solutions.
Choosing a Vortex Core Extraction Method
Two algorithms for determining the location of the vortex cores are available. These methods are represented by the Vorticity Vector and Velocity Gradient Eigenmodes options. The Vorticity Vector method determines the location of vortex cores by examining the vorticity vector. The Velocity Gradient Eigenmodes method is more sophisticated and a little more expensive, using the eigenvalues and eigenvectors of the velocity gradient tensor. The eigenmode method tends to give fewer spurious vortex cores.
Visualizing the Vortex Core Strength
If you have chosen a contour variable for your dataset, the vortex strength returned by the FX library will be stored in this variable in the new zone. You may visualize this vortex strength by turning on the Mesh plot layer and choosing to color the mesh of this zone with the contour variable. You may need to modify the contour levels to get an acceptable display of the vortex strength. You may also wish to use the value blanking feature using this variable to blank out the vortex cores where they are very weak or unrealistically strong (as can happen at a no-slip wall boundary).
21 - 11.3 Extracting Separation and Attachment Lines
Separation and attachment lines show where a fluid flow separates from or reattaches to a no-slip wall boundary. These lines can give you an indication of where separation bubbles or recirculation regions appear in your data. To calculate them you must first identify one or more Wall boundaries using the Geometry and Boundaries dialog. (See Section 21 - 4 “Setting Geometry and Boundary Options”.) The separation and attachment lines will be calculated on these boundaries.
Due to the algorithm used by the FX library to detect separation and attachment lines, these lines may not be detected for flows that are essentially two-dimensional. (That is, flows which contain no variation along one of the three spatial dimensions.)
To calculate separation and attachment lines, select this option in the Feature drop-down and click Extract. The lines, if any, will be displayed in new static zones, one zone for separations lines and a separate zone for attachment lines. As with vortex cores, the lines consist of sets of possibly unconnected line segments, which are displayed using line segment finite element zones. Display the Mesh or Edge layer to see the lines.
21 - 11.4 Excluding Blanked Regions
For vortex core and separation/attachment line calculations in ordered zones, you may choose to exclude blanked regions from the calculation. Select this option by selecting the Exclude Blanked Regions from Ordered Zones toggle. This will prevent lines from being calculated in regions of ordered zones that are not plotted due to blanking. Note, however, that this will invalidate the data journal. If you subsequently save a layout file, you will be prompted to save a new data file as well.