If you wish to plot variables that your XY data file does not include, but which can be derived from available data, you can use the XY Equations dialog to create additional variables. To access this dialog, choose “XY Equations” in the Data menu. Alternatively, if your current plot is an XY type, you can click the  toolbar button.
In the XY Equations dialog, you can use equations to create new variables from combinations of existing variables in your data set. Tecplot RS will include the new variables in the list of variables available for plotting.
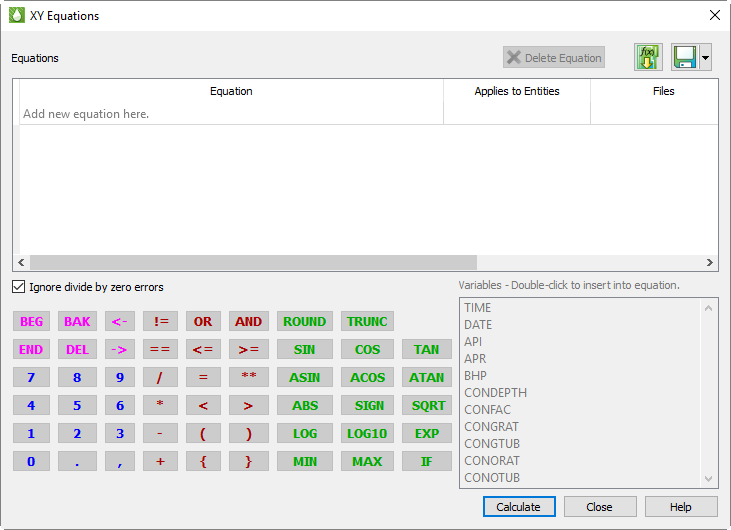
Equations are entered and edited by double clicking on an empty line in the equations table. Once selected, you may enter equations by simply typing them using the keyboard. However, the dialog also provides some handy tools to make the job easier.
First, the variables from the current data set are shown in a list. Double-click one of these to insert it into the equation at the current cursor position. Tecplot RS automatically includes the surrounding curly braces {} that are used to identify a variable.
There are also buttons for frequently-used functions. Clicking these will insert the function name followed by parentheses, and place the cursor inside the parentheses so you can easily insert the value or variable that belongs there. If the function requires multiple parameters, one or more commas will also appear inside the parentheses, alerting you to the required inputs.
The remaining buttons are mostly duplicates of what you have on your keyboard. You can use the keyboard and mouse interchangeably when entering equations. Press the Enter key on your keyboard OR click on the Enter button on the dialog to record an equation.
To make changes to current set of equations, double-click the desired item. You can also use right-click to delete one or more equations that are no longer needed, or by clicking the "Delete" button. When you double click on the empty line, RS inserts the text “{VARNAMEn}=” into the editing line. This is a starting point for entering a new equation, but its use is optional—you can simply type what you need.
Tecplot RS holds XY data in memory. Once a new variable has been created, it remains available during your Tecplot RS session and will be saved if you write your data to Tecplot format.
For a full description of the Tecplot RS equation syntax, see Appendix B: Equation Reference.
You can save and update saved equations in a separate file using the Save As and Save buttons, respectively. Use the Load File button to load a previously saved equation file.
Each equation may be applied to it's own set of entities and/or applied to all files.
Before computing your equations, specify the entities to which you wish to apply the equation by clicking on the "Entities" column and selecting one or more entities to apply the equations to. If you have multiple XY files open, select whether to apply the equation(s) to “All Files” or the “Active file only” by clicking on the 3 column.
|
|
 You can right click on the "Entities" column or "Apply to files" column to quickly select entities/apply to for the selected equation.
Once you have selected the entity types and file settings for all equations, click the "Calculate" button. When the "Calculate" button is clicked, each equation is applied in order starting with the topmost equation in the list. Equations may make use of variables created with previous equations.
After all equations have been calculated, the text color of each equation in the list will be changed as follows.
• Dark Red: There is a syntax error in the equation. When the mouse is hovered over the equation a tool tip will be displayed showing the position of the syntax error. After editing the equation, you can retype the equation and click "Calculate" again.
• Bold Dark Green: The equation has been successfully run and applied.
Once Tecplot RS completes the computation, the new variables appear in the variable lists ready forplotting.
If a division by zero occurs, Tecplot RS will display an error and will not produce any new variables unless the “Ignore /0 Errors” option in the XY Equations dialog is activated. If instructed to ignore division by zero, Tecplot RS produces zero where the variable being divided is zero and -999999 for non-zero dividends, and suppresses the dialog.
As with User Groups, Well Patterns, and Branches, Tecplot RS does not store the new variable values created from the equations in a file. However, you can store the equations themselves. The equations are saved automatically in your project file. The dialog also contains options for saving these in a separate named file.
You can use the XY Equations dialog to create new variables as well as to modify existing ones.
Because the XY Equations dialog allows you to assign new names to the created variables, it is possible to have variables that do not exist in RS Variables Files. When you create a variable, Tecplot RS automatically adds it to the master variable list. See the Variables page..
|
|
 Entity and "apply to" settings for each equation are saved in the project file and when recording macros. However, these settings are not saved in Equation (*.eqn) files. When equations are loaded from an equation (*.eqn) file, entity and "apply to" settings will be set to default for each equation.