In the Grid Equations dialog, you can create new variables from existing grid data. Access this dialog by choosing “Grid Equations” from the Data menu. Alternatively, if your current plot is 2D or 3D grid, you can click the  toolbar button.
With grid equations, you can use equations to create new variables from combinations of existing variables in your data set. Tecplot RS includes the new variables in the list of variables available for plotting. If your new variable definition depends on existing time-dependent data, Tecplot RS re-calculates the variables when the time step changes.
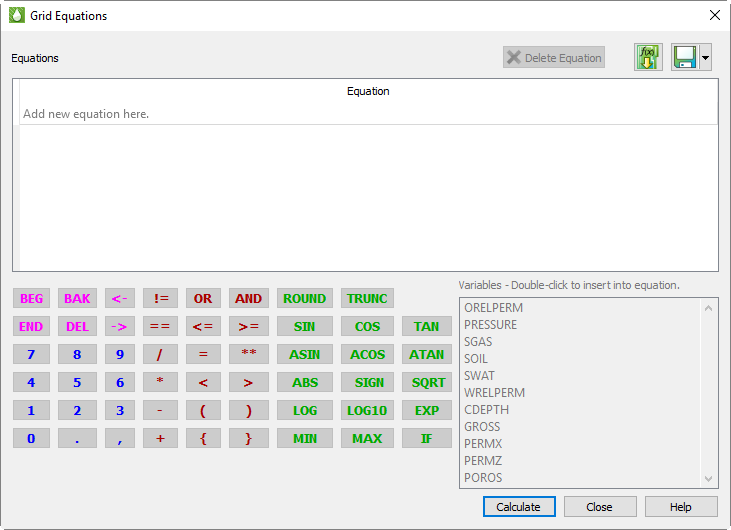
Equations are entered and edited by double clicking on an empty line in the equations table. Once selected, you may enter equations by simply typing them using the keyboard. However, the dialog also provides some handy tools to make the job easier.
First, the variables from the current data set are shown in a list. Double-click one of these to insert it into the equation at the current cursor position. Tecplot RS automatically includes the surrounding curly braces {} that are used to identify a variable.
There are also buttons for frequently-used functions. Clicking these will insert the function name followed by parentheses, and place the cursor inside the parentheses so you can easily insert the value or variable that belongs there. If the function requires multiple parameters, one or more commas will also appear inside the parentheses, alerting you to the required inputs.
The remaining buttons are mostly duplicates of what you have on your keyboard. You can use the keyboard and mouse interchangeably when entering equations. Press the Enter key on your keyboard OR click on the Enter button on the dialog to record an equation.
To make changes to current set of equations, double-click the desired item. You can also use right-click to delete one or more equations that are no longer needed, or by clicking the "Delete" button. When you double click on the empty line, RS inserts the text “{VARNAMEn}=” into the editing line. This is a starting point for entering a new equation, but its use is optional—you can simply type what you need.
Tecplot RS holds XY data in memory. Once a new variable has been created, it remains available during your Tecplot RS session and will be saved if you write your data to Tecplot format.
For a full description of the Tecplot RS equation syntax, see Appendix B: Equation Reference.
18 - 2.1 Calculating Grid Equations
After you enter an equation, the equation will be automatically checked to be sure the syntax conforms to Tecplot RS requirements and that the variable names referenced are valid. This check works only if you have grid data loaded and a 2D or 3D Grid view displayed.
|
|

After entering the equation, the text of the equation is colored as follows:
• Dark Red: There is a syntax error in the equation. When the mouse is hovered over the equation a tool tip will be displayed showing the position of the syntax error. After editing the equation, you can retype the equation and click "Calculate" again.
• Green: The equation has been checked for syntax errors, but it has not yet been applied. Click the "Calculate" button to apply the equations.
• Bold Green: The equation has been successfully run and applied.
Grid equations are always saved with a project file, and are automatically applied when you reload the project without any additional action on your part. You can also save or update saved equations in a separate file and reload them later, which you may find useful when sharing equations among projects. Equations are only calculated when you click the "Calculate" button. If a grid plot type is active, the new variables will also appear in the sidebar variables list when you click the "Calculate" button.
Use the Analyze menu to calculate integrals with Tecplot RS. See Section 20 - 2 “Performing Integrations” for information.