20 - 2 Performing Integrations
To analyze your data using integration, choose “Integration” from the Analyze menu or click the  button in the toolbar. (Integration cannot be performed when the KSum or KAvg toggle is active.) The Integration dialog appears.
The integration operation sums variable values from the grid cells in the current plot view, determined by the variable value and time step selected on the Tecplot RS sidebar. You may use variables derived from equations and time delta values, as well as variables from your data file. If your plot contains multiple frames, only the values in the first frame are used.
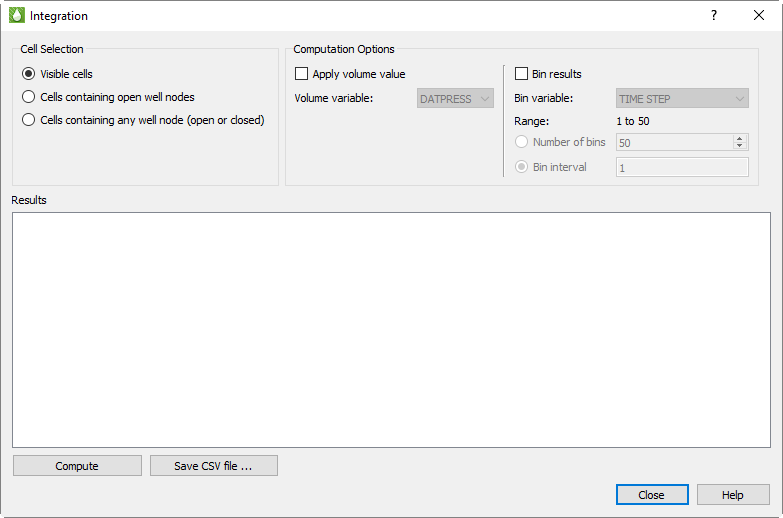
Using the Cell Selection radio buttons in the dialog, you can choose to integrate over all visible cells in the current plot or only cells containing completion nodes.
• Visible cells - All nodes shown in the current plot. If you are using the 2D grid plot type, you can sum values in a single I, J, or K plane. When displaying the grid in 3D, you can sum all of the cells or use the inside views and/or cell blanking to limit the integration to selected areas of the grid.
• Cells containing well nodes - You may choose either all cells containing any well node (both open and closed), or only those containing open well nodes. Integration is further limited to the wells that are selected for display using the [...] button next to the Wells toggle on the sidebar.
If you have chosen to integrate over all visible cells, you may bin the results into groups, similar to binning in histograms. (Results are always binned by the individual wells when integrating over only the cells containing wells, so additional binning is not available in this situation.) Using binning, you could, for example, group the results according to the cell depth or FIP number. When you chose to bin the values, the results include separate sums for all the cells that fall into each bin, plus, as usual, the total for all visible cells.
To activate binning, toggle on the Bin results checkbox, then choose the binning variable from the list. (Variables calculated from equations are not available for binning.) The dialog displays the range of the selected binning variable and asks you to choose how to determine the bin sizes.
• Number of bins - Ranges from 2 to 100. This is generally the simplest option, but you may not get the exact number of bins you requested; Tecplot RS automatically adjust the bin ranges to “nice” values depending on your data (you might, for example, get a range of .2 to .4 for a bin instead of .1733 to 3.3487).
• Bin interval - This choose the interval directly and is not adjusted by Tecplot RS.
If your grid contains transient data, the bin variable list also includes TIME or TIME STEP, either of which is handled differently from other variables. When TIME or TIME STEP is selected, Tecplot RS animates through the time steps in the grid data and integrates at each step. This operation may be slow for large grids with many time steps. You won’t see the plot change during the integration, but when integration is complete, the plot displays the final time step.
20 - 2.3 Applying Volume Values
You may display additional data with a volume variable applied, expanding the results to include values that reflect the product of the volume variable and the current contour value. Variables commonly used for this function include Pore Volume or Cell Volume.
|
|
 If the volume of a cell must be computed from other variables (such as DX * DY * DZ), use the
 Click the Compute button to perform the integration and display the values computed from the grid cells in the table at the bottom of the dialog. If you change any setting in the Integration dialog or any of the values or settings that have an influence on integration (for example, blanking criteria, variable, or time step), you must click Compute again to display updated results.
The results include:
|
# Cells |
How many cells were included in the computation |
|
Sum |
The sum of the values (of the contour variable displayed in the frame) for all cells included (as determined by the Cell Selection and Binning options) |
|
Min/Max |
The smallest and largest value for the cells in a bin |
|
Avg |
Sum divided by the number of cells |
|
Product Sum |
Sum of all product values (that is, the contour variable value multiplied by the Volume variable value) in each cell |
|
Volume Sum |
Sum of all Volume variable values |
|
Product Avg |
Product Sum (see above) divided by the number of cells |
|
Weighted Avg |
Product Sum divided by Volume Sum |
In addition to displaying the results in the dialog, you may click to Save CSV File button to export the results to a comma-separated value file suitable for import to Microsoft Excel and other software.