The Rendering page of the Performance dialog has the following options:
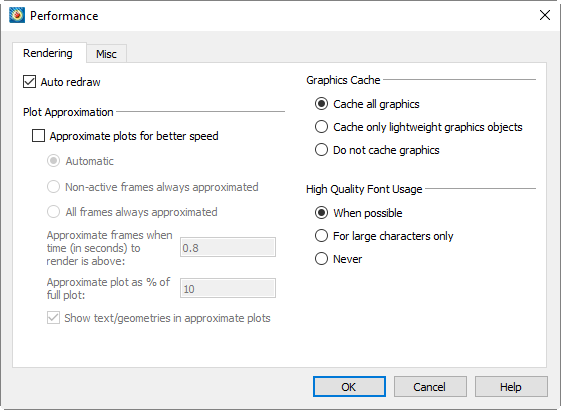
• Auto Redraw - When selected, Tecplot 360 EX will automatically redraw the plot whenever style or data changes. Some users prefer to turn this option off while changing multiple style settings, and then manually pressing Tecplot 360 EX's [Redraw] button on the Plot sidebar to see the full plot.
|
|
 Auto-redraw can be interrupted with a mouse click or key press.
• Approximate Plots for Better Speed - An approximate plot may be used when manipulating the plot to improve interactive performance. This feature is most useful on older, slower hardware and defaults to off. Approximate plots may also be used for non-active frames. The degree of detail of the approximation is controlled by the following settings:
• Automatic - When the time to render (in seconds) is above the set threshold, Tecplot 360 EX will render the approximate plot for style, data, and interactive view changes, followed immediately by the full plot. This option provides for good interactive performance with the final plot always displayed in the full representation.
• Non-Active Frames Always Approximated - When only one frame exists, this option is equivalent to automatic mode. If more than one frame exists, the active frame is set to automatic mode while the other frames are approximated.
• All Frames Always Approximated - When the number of data points is above the point threshold, Tecplot 360 EX will render the approximate plot in any frame. To see the full representation press the [Redraw] button on the Plot sidebar.
• Approximate Frames when Time (in seconds) to Render is Above - Use this value to determine when to automatically turn on plot approximation for all frames. All frames will be approximated when the time to render the plot (all frames) while doing interactive view changes (rotation, translation, scaling) is greater than the supplied value. This setting does not apply when using the "All Frames Always Approximated" mode.
• Approximate Plot as % of Full Plot - This value controls the percentage of geometric detail represented by the approximate plot. The larger the percentage the more closely the approximation represents the original plot. However, the interactive performance is reduced. This number should be adjusted until there is a balance between good interactive performance and sufficient detail. Typically, the percentage should be set to be less than or equal to 50. If values larger than 50% are needed to provide sufficient detail, consider not using approximate plots.
Tecplot 360 EX uses OpenGL to render plots. OpenGL provides the ability to cache graphic instructions for rendering and can re-render the cached graphics much faster. This is particularly true for interactive manipulation of a plot. However, this performance potential comes at the cost of using more memory. If the memory need is too high, the overall performance could be less.
Use one of the following Graphics Cache modes to optimize your computer's performance:
• Cache All Graphics - When selected, Tecplot 360 EX assumes that there is enough memory to generate the graphics cache. If this is valid, Tecplot 360 EX's rendering performance will be optimal for interactive manipulation of plots.
• Cache Only Lightweight Graphics Objects - Lightweight objects include approximate plots and some other minor items, but do not include full plots. This is a good setting for memory constrained problems. Consider using this option in conjunction with the "Plot Approximation" mode set to "All Frames Always Approximated".
• Do Not Cache Graphics - Consider using this option when memory is very limited. If you intend to interact with the plot, also consider setting the "Plot Approximation" mode set to "All Frames Always Approximated".
|
|
 In order to optimize animation, graphics caching is temporarily disabled during animations that include zones, line mappings, time, or blanking elements. Graphics caching is not altered during animations that include slices, streamtraces, or iso-surfaces.
Tecplot 360 EX supports high quality TrueType fonts and can use any TrueType font installed on your system. (See Section 18 - 1.2 “Font Folders and Fallback” for more information on how fonts work with Tecplot 360 EX.)
Tecplot 360 EX has three high quality font modes:
• When Possible (Default setting for Windows) - Tecplot 360 EX uses available TrueType fonts for any size text. This produces the best rendering quality; however, performance is slower for large amounts of text.
• For Large Characters Only - Tecplot 360 EX uses the TrueType fonts for large characters only. Small characters will use Tecplot 360 EX's built-in stroke fonts. This is a good blend of quality and performance. However, small characters may not have the same appearance as large characters.
• Never - Tecplot 360 EX never uses TrueType fonts.
Best Practices For Rendering Performance
The factory settings in the Performance dialog are designed for moderately-sized data and occasionally may need to be adjusted to optimize Tecplot 360 EX's rendering performance. For example, if you are doing a lot of interactive work with your data, you may wish to turn on Plot Approximation to make these operations more responsive. If you do not have much spare memory, you may wish to turn off the Graphics Cache, or set it to "Cache only Lightweight Graphics Objects."
|
|
 The size of the data isn't the only factor when rendering in
 If you are using Plot Approximation, adjust the "Approximate Plot as % of Full Plot" value to give an acceptable balance between interactive performance and plot detail.
30 - 3.2 Miscellaneous Settings
The Miscellaneous page of the Performance dialog has the following functions:
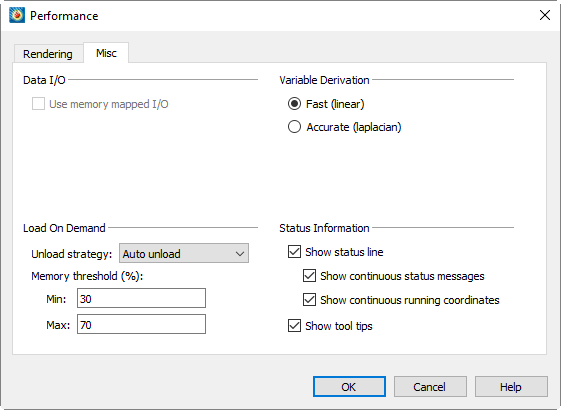
• Use Memory Mapped I/O - When toggled-on, Tecplot 360 EX will use system level memory mapping functions to map Tecplot 360 EX variables directly over block data in a binary data file or layout package file. Doing this at the system level generally provides the best available performance for loading the data.
The advantage of mapping variable data is that Tecplot 360 EX will only load the variable when it is needed, not when initially opening the file (but see also Load On Demand in this dialog). In addition, the mapped variable data can be shared between other Tecplot 360 EX sessions running on the same machine, saving memory. Memory mapped I/O is most useful when there are a large number of data points to load from a file and they are not all being used by Tecplot 360 EX at the same time. Only variable data that is in a binary block format (the default for .plt files generated by Tecplot 360 EX) can be memory mapped.
With load-on-demand activated, Tecplot 360 EX generates plots faster and using less memory by only loading data that is needed for the plot. If changes to the plot style require additional variables to be loaded, Tecplot 360 EX will automatically load them, and if necessary, unload variables that are no longer used. Tecplot 360 EX's ability to automatically load and unload variables on demand allows you to examine data that is much larger than the physical or virtual memory of your computer.
|
|
 This setting does not affect reading data in Tecplot Subzone
 For large datasets, only the zones and variables currently in use will be loaded. However, for small datasets, some other zones and variables may be loaded for you (based on the Memory Threshold).
• Unload Strategy - Specifies how to manage unloading variables and other load-on-demand resources.
• Auto Unload - This strategy attempts to keep Tecplot 360 EX's memory use within the defined Min and Max Memory Thresholds. Tecplot 360 EX uses these values to determine when and how much it should unload This is the best option for exploring data as Tecplot 360 EX only unloads if and when the memory threshold has been exceeded; if the threshold is not exceeded, data loaded on-demand remains available in memory if you need it again.
• Minimize Memory Use - This strategy is used if more aggressive unloading of variables and other load-on-demand resources is required. This option is best suited for animating through a very large number of time steps, where each time step consumes a significant part of the computer's available physical and virtual memory.
• Never Unload - This strategy disables the unloading capability of load-on-demand while still preserving the ability to load variables on demand.
|
|
 Most users should select either the "Auto Unload" or "Minimize Memory Use" options.
• Memory Threshold (%) [Auto Unload ONLY] - When Tecplot 360 EX uses at least the maximum percentage of the available physical and virtual memory, it will attempt to unload variables and other load-on-demand resources until the available physical and virtual memory is at or below the specified minimum percentage.
When Tecplot 360 EX needs to create a nodal variable from a cell centered variable, it uses a prescribed derivation method. Tecplot 360 EX provides two such derivation methods: fast and accurate.
• Fast (Linear) - When selected, Tecplot 360 EX uses simple averaging to derive a nodal variable from a cell centered one.
• Accurate (Laplacian) - When selected, Tecplot 360 EX uses Laplacian interpolation to derive a nodal variable from a cell centered variable.
Use the following controls in the Status Line region of the Performance dialog to customize what is displayed in the status line:
• Show Status Line - Turn this preference on/off to control the display of status messages.
|
|
 If you are remotely displaying
 • Show Continuous State Messages - Turn on this control to receive context-sensitive commentary in the status line.
• Show Continuous Running Coordinates - Turn on this control to display the coordinates of your mouse cursor in the status line.
• Show Tool Tips - Use this option to turn tool tips on or off.