You can view loaded XY data in the Data Spreadsheet dialog by choosing “Spreadsheet” from the Data menu. In this dialog, you can edit data, adjust the formatting of the displayed data, copy the data to your operating system’s clipboard, and paste it into another program.
The Data Spreadsheet dialog displays the entities and variables selected in the sidebar: the entity appears in the Zone menu, and the variables currently chosen for that entity appear in the table below.
|
|
 You must have at least one entity and one variable selected in the sidebar in order to open the
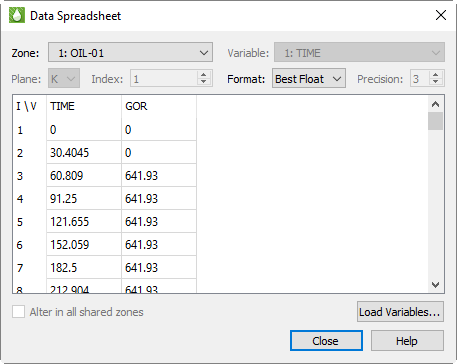
9 - 1.1 Spreadsheet Formatting
Using the formatting controls at the top of the Data Spreadsheet dialog, you can change the format of the displayed data without changing your data file(s) or the appearance of your plot.
• Format Choose a number format from the Format menu in the dialog that best represents the data. You can choose from displaying the data in Integer, Float, Exponent, or Best Float form.
• Precision If you have Float or Exponent chosen as the Format, you can specify the number of places displayed to the right of the decimal.
If some values are too wide to fit in their column, the width of the column may be adjusted by dragging the divider lines in the heading.
9 - 1.2 Editing Spreadsheet Data
To edit any displayed value, double-click it, type the new value, and press Enter. Changes made here are applied only to the plot; they do not affect the underlying data set. If you change the plot type, your changes will be lost.