The Grid Axes page includes selections for formatting the grid axes and 3D Views. You can quickly access this page of the Plot Options dialog by double-clicking on one of the axes in a 2D or 3D Grid plot. Or choose “Plot Options” from the Options menu.
This page allows you to customize axis labels and display (3D Grid only).
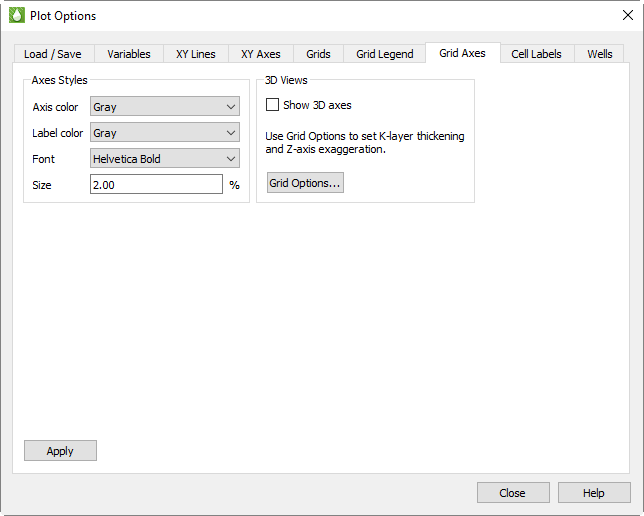
In the Axes Styles region of the Grid Axes page, you can customize the way axis labels appear on your plot with the following options:
• Axis Color - Choose from 26 standard colors in this menu to assign the color of the selected axis.
• Label Color - Choose from 26 standard colors to assign the color of the selected axis label.
• Font - Choose from a list of available fonts to assign the font in which the axis label will display.
• Size - Choose the size of the axis label’s font as a percentage of frame height.
In the 3D Views region of the Grid Axes page, you can choose whether to include the axes display on 3D views (2D views always include the axes). Toggle-on “Show 3D Axes” to display the axes in a 3D Grid plot.
To customize additional characteristics of 3D Grid plots, use the Grid Options dialog, which you can access by clicking the Grid Options button or by clicking Grid in the 2D or 3D sidebar.