It is often useful to compare history data of a reservoir with multiple simulation runs to determine which simulation best matches the history data. While other comparison methods give good qualitative comparison results, when that is not sufficient, you can use the History Match plot type to compare data sets in a quantitative, visually diverse manner.
You can compare data sets using History Match plots in two ways. In the One Well mode, Tecplot RS shows you how the comparison data for a single well deviates from the history data over time (or as another independent variable changes). In the Multi Well mode, Tecplot RS shows you how the comparison data for a single date deviates from the history data from well to well.
To use the History Match plot type, with XY data loaded, choose History Match from the Plot Type menu in the sidebar or from the Plot Type menu in the menu bar.
The History Match plot type displays three frames at once, showing three different comparisons of the data sets: the raw data, the deviation data, and the deviation distribution.
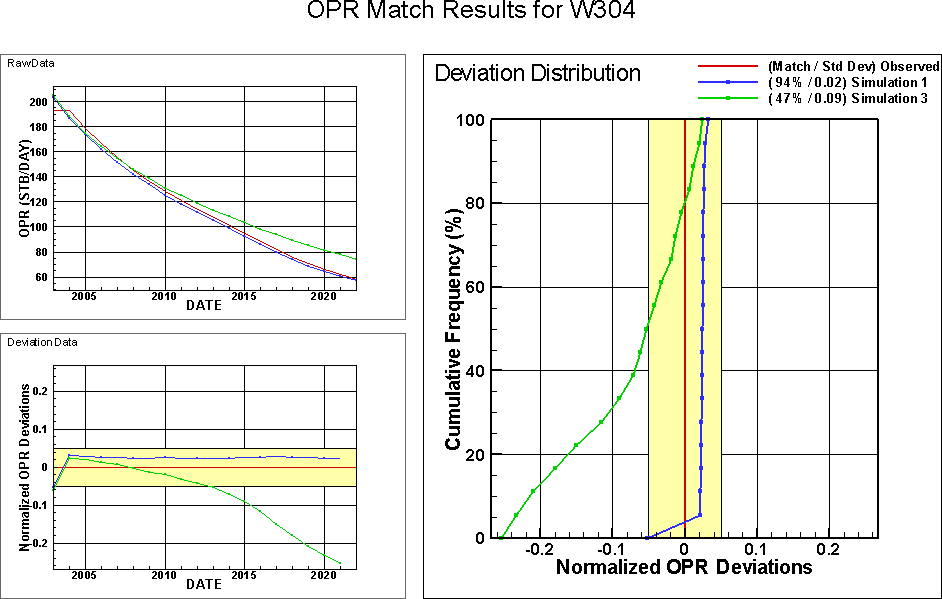
An example of the three frames that display when the History Match plot type is selected. In this example, the red line is a display of the observed data, and the blue and green lines represent simulated data sets.