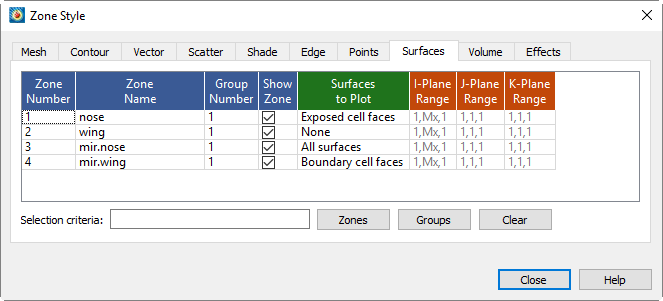
There are many ways to divide volume data for plotting. One way to view volume data is to select surfaces from part of the data. In Tecplot 360 EX you may choose which surfaces to plot for volume zones from the Surfaces page of the Zone Style dialog (accessed by double-clicking on a zone via the Plot sidebar, or via Plot>Zone Style.
|
|
 For information on using the controls at the bottom of the Zone Style dialog to select zones by name or by group number, see the description of these at the end of
 Right-click in the Surfaces to Plot column to choose one of the following:
• None - None of the volume zone surfaces are plotted (edges still appear). This is the default Surfaces setting for your plot.
• Boundary Cell Faces - Plots all surfaces on the outside of the volume zone. This includes:
• IJK-ordered data - The minimum and maximum I, J, and K-planes are plotted.
• Finite element volume data - All faces that do not have a neighbor cell (according to the connectivity list) are plotted.
If blanking is turned on, the boundary cells in the blanked region will not be drawn and you will be able to see the interior of the volume zone. Figure 7-3 shows plots of a volume zone with Surfaces to Plot set to "Boundary Cell Faces": without blanking, with value blanking, and with IJK-blanking. See Chapter 19: “Blanking” for information on working with Blanking.
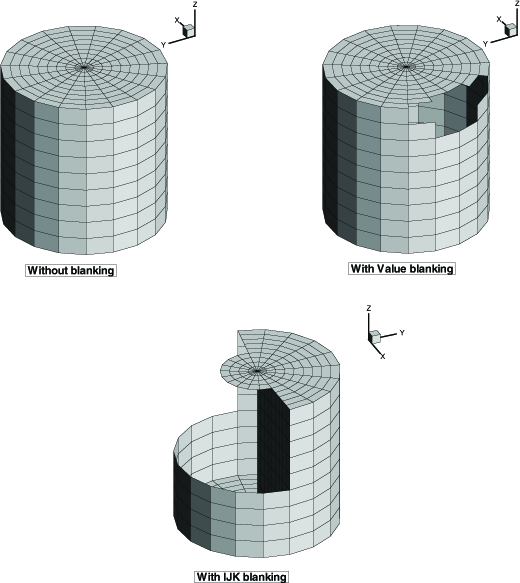
Figure 7-3. Boundary Cell Face plotting without blanking, with value-blanking, and with IJK-blanking.
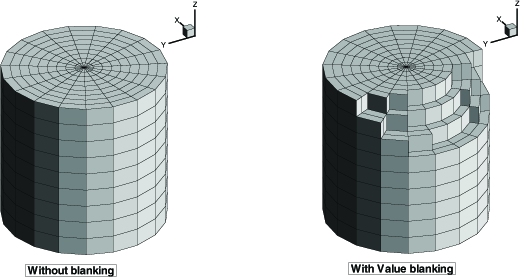
• Exposed Cell Faces (default) - This setting is similar to the "Boundary Cell Faces" setting, unless value blanking is active. When value blanking is used, the outer cell faces between blanked and non-blanked cells and the outer surfaces of the data are drawn. Figure 7-4 shows a plot of a volume zone with Surfaces to Plot set to "Exposed Cell Faces" with and without value blanking. See Chapter 19: “Blanking” for information on working with Blanking
.
Figure 7-4. Examples of plots where Surfaces to Plot has been set to "Exposed Cell Faces" with (left) and without (right) value-blanking.
• Planes Settings (I, J, K, IJ, JK, IK, and IJK-planes) - Plots the appropriate combination of I, J, and/or K-planes. The planes are determined by the Range for each plane, which can be set by right-clicking in a range column. These settings are available only for IJK-ordered data. Figure 7-5 shows a number of examples of plotting I, J, and K-planes.
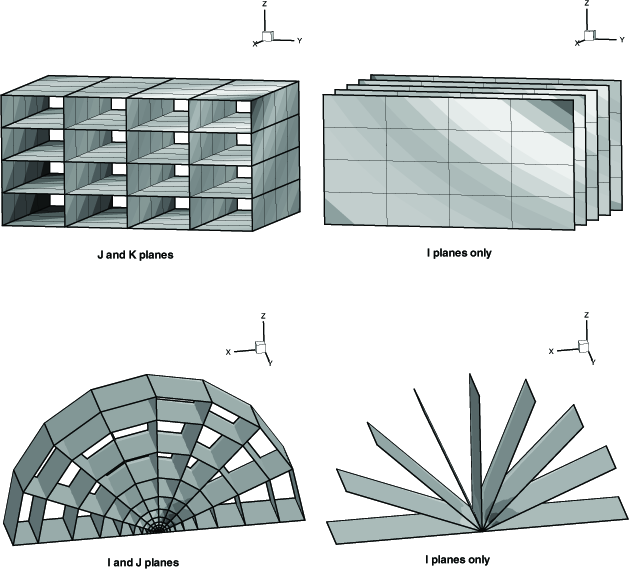
Figure 7-5. Examples of plotting I, J, and K-planes.
• Every Surface (Exhaustive) - This setting will plot every face of every cell in volume data. It is not recommended for large datasets. Unless the surfaces are translucent, the plot will appear the same as the Exposed Cell Faces setting.
• Ranges - The Range for I, J, or K Planes options allow you to specify the ranges for the corresponding planes. Right-click in the appropriate Range column to enter the range as the beginning plane, the ending plane (0 indicates the maximum index, -1 the next highest, and so on) and the skip factor in the Enter Range dialog. Use a skip factor of two to display every other plane, a skip factor of three to display every third plane, and so on.