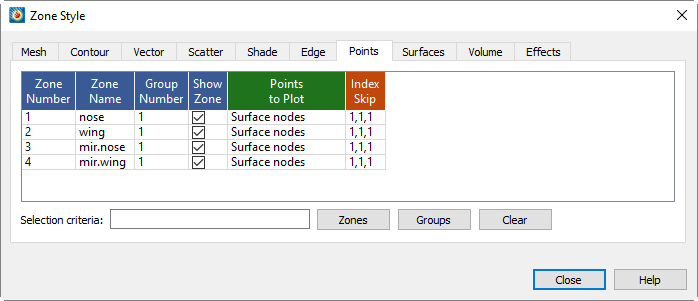
You may select the source for the data points used to plot vectors and scatter symbols from the Points page of the Zone Style dialog (shown below).
|
|
 For information on using the controls at the bottom of the Zone Style dialog to select zones by name, see the description of these at the end of
 Figure 7-2 shows a plot where zone 1 is plotting scatter symbols only on one plane (J=5) and zone 2 is plotting all symbols.
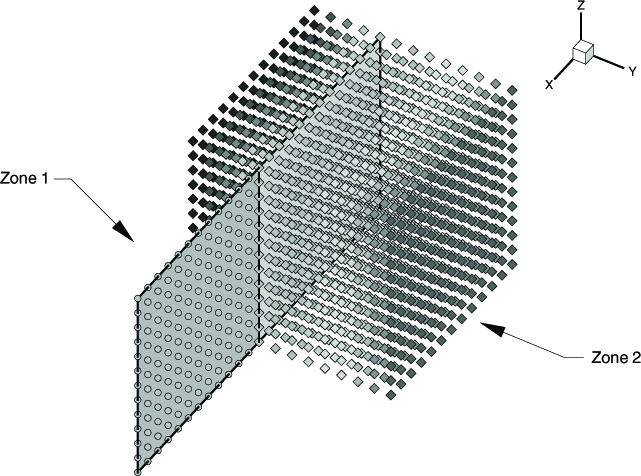
Figure 7-2. A plot showing two zones set to show only J-planes equal to five, with scatter symbols plotted on the surface in zone 1 and all symbols in zone 2.
• Points to Plot - Right-click to select how the points are plotted:
• Nodes on Surfaces - Draws only the nodes that are on the surface of the zone.
• All Nodes - Draws all nodes in the zone.
• All Connected - Draws all the nodes that are connected by the node map. Nodes without any connectivity are not drawn.
• Cell Centers Near Surfaces - Draws points at the cell centers which are on or near the surface of the zone.
• All Cell Centers - Draws points at all cell centers in the zone.
• Index Skip - Right-click to specify the skip intervals for the I, J, and K-indices. The menu options are as follows:
• No Skip - Set the I, J, and K-skip intervals to one; plot all points or vectors.
• Enter Skip - Specify I, J, and K-skip intervals on the Enter Index Skipping dialog.
|
|
 For irregular and finite element data, only the I-Skip has an effect. I-skip will allow you to skip through nodes in the order they are listed in the data file.