20 - 10 Irregular Data Point Triangulation
Triangulation is a process that connects data points to form triangles. You can use triangulation to convert irregular I-ordered datasets into a finite element surface zone. Triangulation is one of the two options for creating field plots from irregular data. The other is interpolation, discussed in Section 20 - 9 “Data Interpolation”. Triangulation preserves the accuracy of the data by creating a finite element surface zone with the source data points as nodes and a set of triangle elements. Triangulation works best for irregular data.
To triangulate 2D data, make sure your plot is in 2D Cartesian mode and select 2D Triangulation from the Data menu. The 2D Triangulation dialog has the following options:
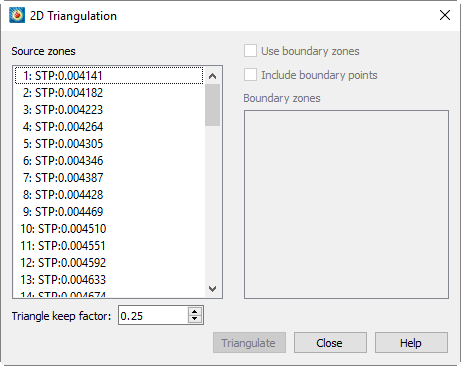
• Source Zone(s) - Select the zone or zones to triangulate from the list.
• Use Boundary Zone(s) - Toggle-on to specify a boundary zone for the triangulation. Select the boundary zone or zones from the list. The boundary zones define the boundaries in the triangulation region. If you do not include boundary zones, Tecplot 360 EX assumes the data points lie within a convex polygon and that all points in the interior can be connected.
• Include Boundary Points - Toggle-on to include the points in the boundary zones in the triangulated zone.
• Triangle Keep Factor - This factor is used to define which triangles on the outside of the triangulated zone are "bad" and not included in the triangulation.
At the completion of triangulation, Tecplot 360 EX attempts to remove bad triangles from the outside of the triangulation. The keep factor is a description of the shape of the triangle between zero (three collinear points) and 1.0 (an equilateral triangle). Typical settings are values between 0.1 and 0.3; settings above 0.5 are not permitted. Bad triangles will not be removed if removing the triangle strands a data point.
• Triangulate - Click the [Triangulate] button to perform the triangulation.
After triangulating your data, you can use the resulting finite element surface zone to create plots. Generally, you turn off the original zone(s) and plot the new zone only, but you can, for example, plot a scatter plot of the original zone(s) along with the contours of the new zone.