Surface streamtraces or streamlines are confined to the surface on which they are placed. They can only be placed in zones displayed as a 2D or 3D surface. If you try to place streamlines in a zone displayed as a 3D volume, an error dialog appears, and no streamlines are drawn. The following attributes may be set with the Lines page of the Streamtrace Details dialog. You cannot customize streamtraces using the Lines page until after at least one streamtrace has been drawn.
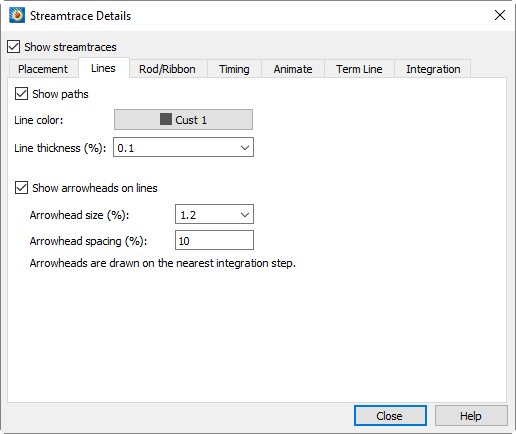
• Show Paths - Toggle-on to include streamtraces in your plot.
• Line Color - Select the color for all streamtraces in the Color Chooser. You may set the color to Multi-color to color the streamtraces by the chosen contour group variable in the same manner as color flooding. (If the contour variable is not currently defined, the Contour Variable dialog appears so that you can define it.) You can use the Multi-color option, for example, to color the streamtraces by the local temperature or by the velocity magnitude. You can also specify RGB coloring.
The following attributes affect surface and volume streamlines:
• Line Thickness - Enter a value, or choose a pre-set value for the streamline thickness (as a percentage of the frame height for 2D lines and as a percentage of the median axis length for 3D surface lines and volume lines), or choose a pre-set value from the drop-down menu.
• Arrows - Toggle-on Show Arrowheads on Lines to display arrowheads along all streamlines (surface and volume) in the active frame. Arrows are not shown on volume ribbons or volume rods. You can also control the following attributes of the displayed arrows:
• Arrowhead Size - Either enter a value for the arrowhead size (as a percentage of the frame height), or choose a pre-set value from the drop-down menu.
• Arrowhead Spacing - Enter the distance between arrowheads in terms of Y-frame units. A value of ten percent will space arrowheads approximately ten percent of the frame height apart from each other along each streamline.