In the XY Line plot type, you can assign one or more variables to be used to compute error bars for another variable. Each mapping can be associated with only one error bar variable. If you want to assign multiple error bar variables to a mapping, create a copy of the mapping for each error bar variable.
An example plot with error bars is shown in Figure 6-7.
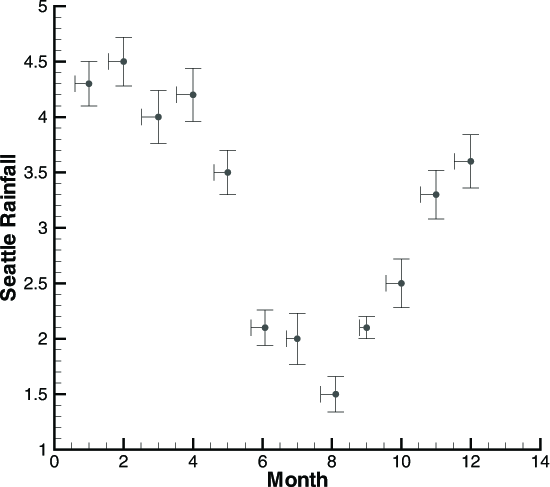
Figure 6-7. An XY Line plot with symbols and error bars.
You can use any variable in your dataset as an error bar variable. However, for them to be meaningful, they should have the same units as the axis along which they are drawn.
|
|
 If error bar values are not included in your original dataset, you may create error variables using