17 - 3 Axis Range Options for XY and 2D/3D Plots
This section discusses the options for XY Line, 2D Cartesian, and 3D Cartesian plots that can be found on the Range page of the Axis Details dialog.
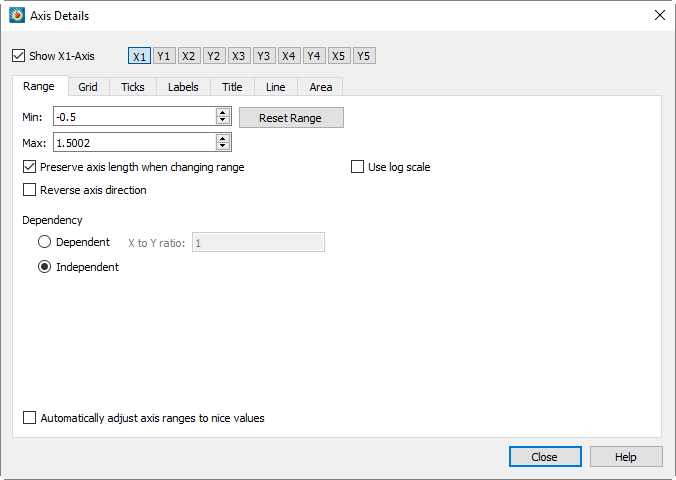
The Range page has the following options:
• Show Axis - Toggle-on this checkbox to show the selected axis (n) on the plot. Use the buttons [X], [Y], etc. to the right of this checkbox to select the axis to show.
• Min - Enter the minimum value of the axis range.
• Max - Enter the maximum value of the axis range.
• Reset Range - Reset the Max and Min fields by selecting one of three options from the drop-down menu:
• Reset to Nice Values - Sets the range to slightly larger than the current axis variable range in order to begin and end the axis at major axis increments.
• Set to Variable Min/Max - Sets the range to the minimum and maximum variable values, considering the effects of blanking.
• Make Current Values Nice - Rounds the axis range to the nearest major axis increment.
• Preserve axis length when changing range - If toggled-on, and your axes are Independent, changes to the X to Y Ratio will affect the axes' range, but not their scale. Toggle-off to change both the axis range and axis scale simultaneously. See Figure 17-4 for an illustration of the difference.
• Use log scale - The X and Y axes of XY Line plots can have a linear scale (default) or a logarithmic scale. When "Auto Spacing" is selected with logarithmic scale, large numbers are displayed in scientific notation (i.e., 3.48x10⁵). It is strongly recommended that you use "Auto Spacing" with log axes. Navigate to the Ticks or Labels page of the dialog, and toggle-on "Auto Spacing" to use this option.
• Reverse axis direction - Toggle on to display the axis from high to low rather than from low to high. Not available for 3D Cartesian plots.
• Dependency - Select whether to set the axes as dependent upon or independent of each other. For XY Line or 2D Cartesian, select "Independent" or "Dependent".
|
|
 When a logarithmic scale is being used in an XY Line plot, the axes must be independent.
For 3D Cartesian, select from one of the following options:
• Independent - All axes are independent.
• XY Dependent - The X and Y axes are dependent upon each other. The Z axis is independent.
• XYZ Dependent - Changing the scale on any axis results in a proportional change in scale on the other two axes, so that the specified X to Y Ratio and X to Z Ratio are preserved.
• Ratios (For 2D and 3D plots only)
• 2D Plots - If "Dependent" is selected, enter the X to Y Ratio.
• 3D Plots - If "XY Dependent" is selected, enter the X to Y Ratio.
• 3D Plots - If "XYZ Dependent" is selected, enter the X to Y Ratio and the X to Z Ratio.
• Automatically Adjust Axis Range to Nice Values - Automatically adjusts the axis ranges to the nearest major axis increments.
• Size Factors (For 2D and 3D plots only) - If the axes are XY-dependent, changing the X or Y size factor changes the other. If the axes are XYZ-dependent, changing one size factor changes the other two.
• Reset Size/Dependency - Resets the Dependency controls to their defaults.
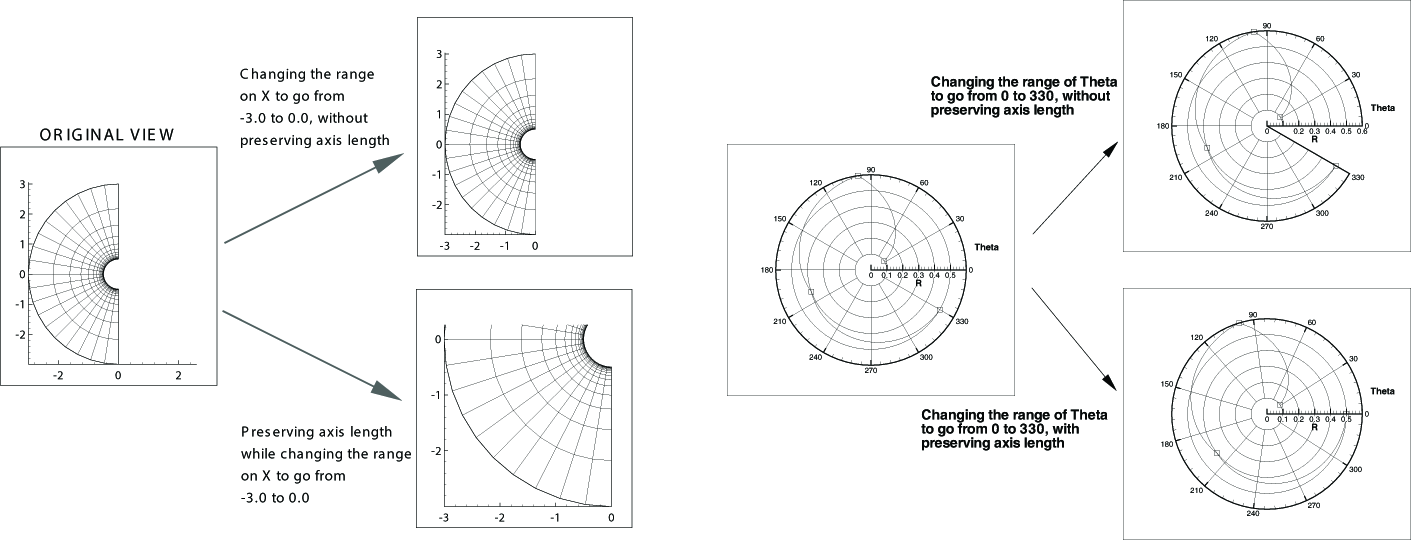
Figure 17-4. Preserving length versus preserving scale while changing range (left); preserving length versus preserving scale while changing range in a Polar Line plot (right).