For transient datasets, you can use the Tecplot 360 EX interface to display your data at a given time or to animate your data over time. The zones loaded into Tecplot 360 EX can be linked to a specific solution time, and the active solution time is used to determine which zones are displayed.
For the following definitions, consider the following fictitious dataset:
|
Zone |
Time |
StrandID |
|
1 |
n/a |
n/a |
|
2 |
0.0 |
2 |
|
3 |
0.18 |
3 |
|
4 |
0.22 |
1 |
|
5 |
0.25 |
2 |
|
6 |
0.28 |
1 |
|
7 |
0.32 |
3 |
|
8 |
0.38 |
2 |
|
9 |
0.42 |
1 |
|
10 |
0.52 |
1 |
|
11 |
0.57 |
2 |
|
12 |
0.58 |
3 |
|
13 |
0.62 |
1 |
|
14 |
n/a |
n/a |
• Transient zones - Zones associated with time. The transient zone(s) displayed in the current frame are dependent upon the current solution time. Zones 2-13 in Table 7 - 1 are transient zones.
• Static zones - Zones not associated with time. They are displayed regardless of the current solution time. Zones 1 and 14 from Table 7 - 1 are static.
• Current Solution Time - The value that determines which transient zones are displayed in the current frame.
• Strand - A series of transient zones that represent the same part of a dataset at different times. Zones 2, 5, 8, and 11 in Table 7 - 1 all have the same StrandID and therefore, they are part of the same strand.
• StrandID - An integer value defined for each transient zone. The StrandID of a given zone is determined by the data loader.
|
|
 Changes made in the Zone Style dialog to any zone in a given StrandID are propagated to all zones with that StrandID. See also
 • Relevant Zone - Only "relevant zones" are plotted at a given solution time. A relevant zone is defined as a zone for a given strand used for a certain solution time. If the strand exists at solution time n, the relevant zone is either the transient zone on that strand defined explicitly at solution time n, or the zone defined immediately prior to solution time n. If the strand does not exist at solution time n, there are no relevant zones for that strand at that time. Static zones are always considered relevant. Refer to Figure 7-7.
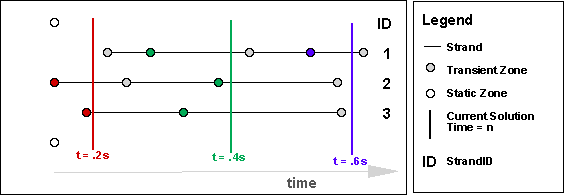
Figure 7-7. An illustration of how relevant zones are determined (based on the data in Table 7 - 1). For a given solution time, the relevant zones ONLY are displayed in the plot. NOTE: static zones are always considered relevant zones.
t = .2s - The red-colored transient zones and both static zones are plotted. NOTE: no zones from the first strand are represented because the strand is not defined at that time.
t = .4s - The green-colored transient zones and both static zones are plotted.
t = .6s - The blue-colored transient zones and both static zones are plotted. NOTE: no zones from the second and third strands are represented because the strands are not defined at that time.