G - 2 Scalar Grid Quality Functions
The ratio of maximum edge length squared to face area:

For a rectangle or square, this simplifies to: 
For collapsed faces where the area is zero, the aspect ratio is set to zero.
For Polyhedral zones, the maximum aspect ratio is calculated for all faces of a given cell.
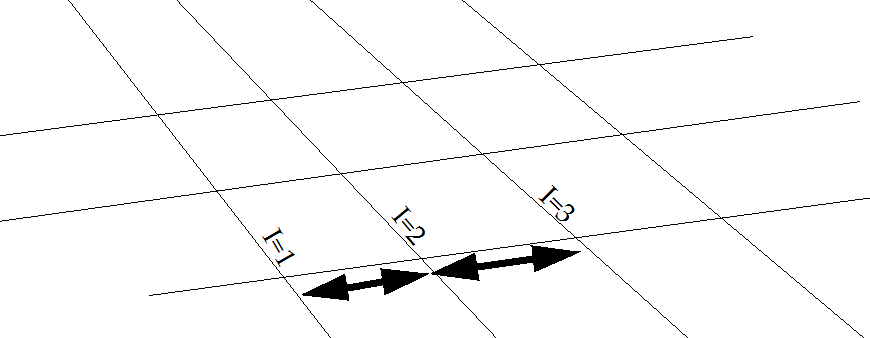
G - 2.2 I, J, or K-stretch Ratio
The ratio of the length of line segment I2-I3 to segment I1-I2 (or J or K):
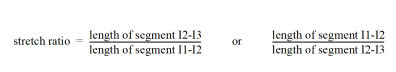
such that the stretch ratio is always > 1.
If either segment has zero length, the stretch ratio is set to one.
Note: If you have specified on the Geometry and Boundaries dialog that adjacent zones are connected, these stretch ratios will be made continuous across connected zone boundaries provided that the index directions are aligned.
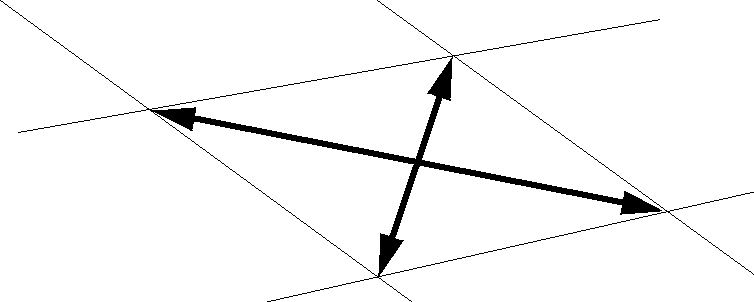
G - 2.3 I, J, or K-face Skewness
The ratio of the two face diagonal lengths subtracted from one (the diagonals are ratioed so that this number is always non-negative):
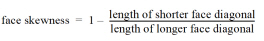 .
.
For polyhedral zones, the cell value is the maximum skewness over all cell faces.
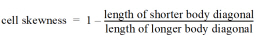
G - 2.4 Cell Diagonal1 or Diagonal2 Skewness
The ratio of the lengths of two body diagonals subtracted from one (always non-negative). There are four body diagonals. We choose pairs which would be coplanar in an unskewed cell, that is, (i,j,k) -> (i+1,j+1,k+1) and (i,j,k+1) -> (i+1,j+1,k).
For polygonal zones, the ratio of the lengths will be zero.
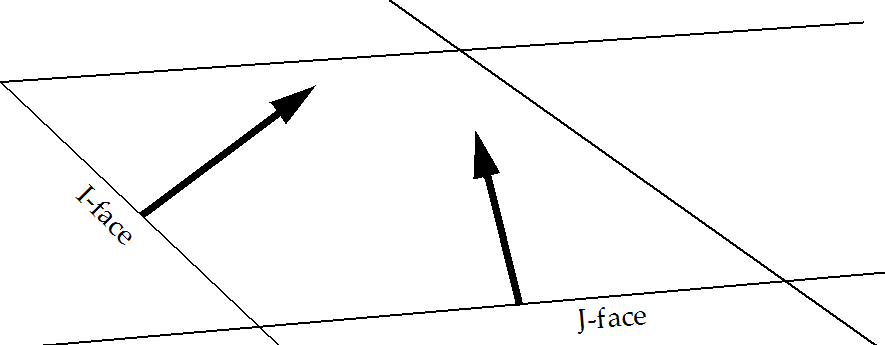
G - 2.5 IJ, JK, KI, or Max Normals Skewness
The dot product of face unit normals for the two given faces.
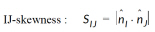
The following figure illustrates this for IJ-skewness.
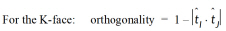
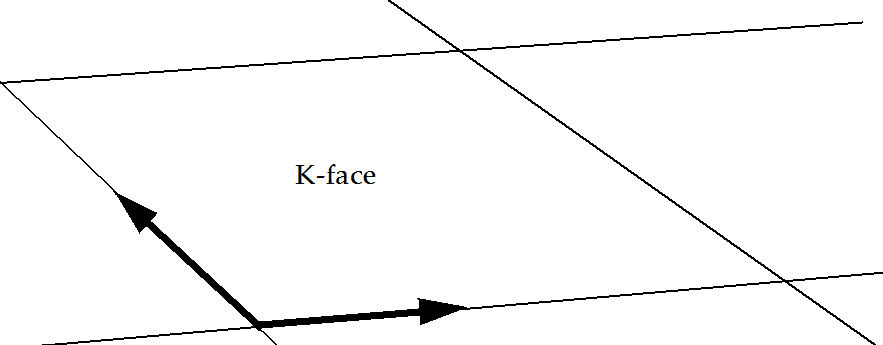
G - 2.6 I, J, K, or Min Orthogonality
One minus the absolute value of the dot product of two unit vectors which point in the direction of two adjacent edges of the given face.
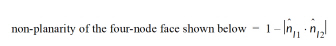
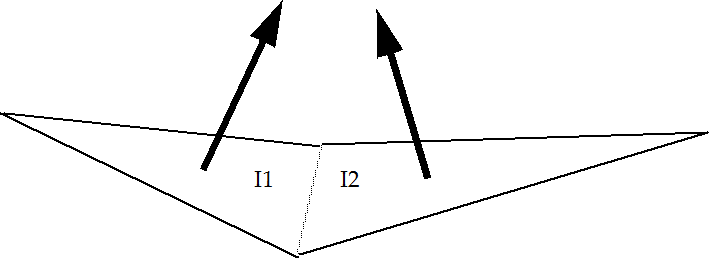
G - 2.7 I, J, K, or Min Nonplanarity
Two triangles are formed with the four nodes of the face, and the dot product of the two unit normals of those triangles is subtracted from one.
For polyhedral zones, the max over all cell faces is found.
For ordered zones, the Jacobian is calculated with the standard formula.

The subscripts above represent partial derivatives, which are approximated with finite differences.
For finite element zones, Tecplot 360 EX approximates the Jacobian by inverting the average areas or volumes of the grid cells surrounding each node, 1/A or 1/V.
If the denominator of the above formula is zero (ordered zones), or all cells surrounding a node have zero area (finite element zones), the Jacobian is set to zero.
For ordered zones, the cell volume for a particular node (I, J, K) is the volume of the cell between nodes (I, J, K) and (I+1, J+1, K+1). In 2D, this function becomes cell area. Nodes on the IMax, JMax, and KMax boundaries are assigned the same value as the nodes at IMax-1, JMax-1, and KMax-1 respectively.
For finite element zones, the cell volume for a node is the average volume (area in 2D) of all cells of which that node is a part.