While finite element data is usually associated with numerical analysis for modeling complex problems in 3D structures (heat transfer, fluid dynamics, and electromagnetics), it also provides an effective approach for organizing data points in or around complex geometrical shapes. For example, you may not have the same number of data points on different lines, there may be holes in the middle of the dataset, or the data points may be irregularly (randomly) positioned. For such difficult cases, you may be able to organize your data as a patchwork of elements. Each element can be independent of the other elements, so you can group your elements to fit complex boundaries and leave voids within sets of elements. The figure below shows how finite element data can be used to model a complex boundary.
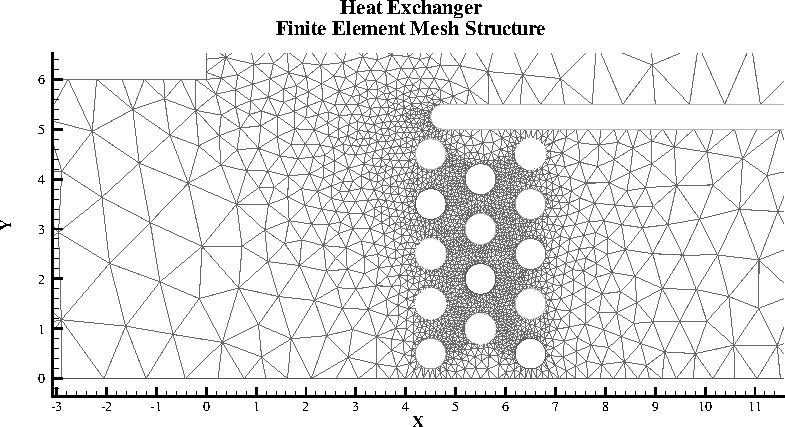
Figure 3-3. This figure shows finite element data used to model a complex boundary.
Finite element data defines a set of points (nodes) and the connected elements of these points. The variables may be defined either at the nodes or at the cell (element) center. Finite element data can be divided into three types:
• Line data is a set of line segments defining a 2D or 3D line. Unlike I-ordered data, a single finite element line zone may consist of multiple disconnected sections. The values of the variables at each data point (node) are entered in the data file similarly to I-ordered data, where the nodes are numbered with the I-index. This data is followed by another set of data defining connections between nodes. This second section is often referred to as the connectivity list. All elements are lines consisting of two nodes, specified in the connectivity list.
• Surface data is a set of triangular, quadrilateral, or polygonal elements defining a 2D field or a 3D surface. When using polygonal elements, the number of sides may vary from element to element. In finite element surface data, you can choose per zone to arrange your data in three-point (triangle), four-point (quadrilateral), or variable-point (polygonal) elements. The number of points per node and their arrangement are determined by the element type of the zone. If a mixture of quadrilaterals and triangles is necessary, you may repeat a node in the quadrilateral element type to create a triangle, or you may use polygonal elements.
• Volume data is a set of tetrahedral, brick, or polyhedral elements defining a 3D volume field. When using polyhedral elements, the number of sides may vary from element to element. Finite element volume cells may contain four points (tetrahedron), eight points (brick), or a variable number of points (polyhedral). The figure below shows the arrangement of the nodes for tetrahedral and brick elements. The connectivity arrangement for polyhedral data is governed by the method in which the polyhedral facemap data is supplied.
|
|
|
|
Tetrahedral connectivity arrangement |
Brick connectivity arrangement |
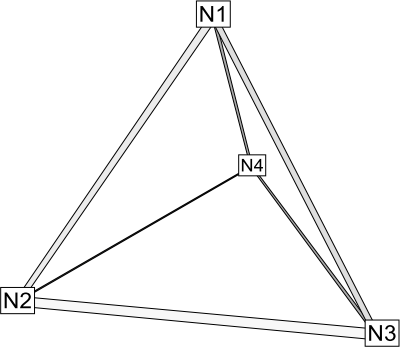
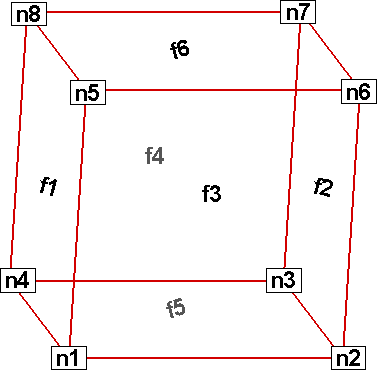
Figure 3-4. Connectivity arrangements for FE-volume datasets
In cell-based element types (triangular, quadrilateral, tetrahedal, or brick), points may be repeated to achieve elements containing a smaller number of points. For example, a connectivity list of "n1 n1 n1 n1 n5 n6 n7 n8" (where n1 is repeated four times) results in a brick-based pyramid element. Any of the points could be repeated; for example, "n1 n1 n3 n3 n5 n5 n7 n7" would also be a valid way to define a pyramidal element in a brick zone.
In Tecplot 360 EX, each FE data zone must be composed exclusively of one element type. However, you may use a different data point structure for each zone within a dataset, as long as the number of variables defined at each data point is the same.
The The Data Format Guide provides detailed information about how to format your FE data in Tecplot's text file format.
3 - 3.1 Finite Element Data Limitations
Working with finite element data has some limitations:
• XY-plots of finite element data treat the data as I-ordered; that is, the connectivity list is ignored. Only nodes are plotted, not elements, and the nodes are plotted in the order in which they appear in the data file.
• Index skipping in vector and scatter plots treats finite element data as I-ordered; the connectivity list is ignored. Nodes are skipped according to their order in the data file.