The Excel Add-In provides a convenient way to load data directly from your Microsoft Excel spreadsheet into Tecplot 360 EX. When loaded, it adds a Tecplot section to the Add-Ins ribbon, which contains a button that lets you open the highlighted region of the spreadsheet in Tecplot 360 EX. (In older versions of Excel, previous to the ribbon user interface, this command appears on the Tools menu and as a button in the toolbar.)
|
|
 The Excel Add-In is available on Windows platforms only and requires Microsoft Excel be installed. Visual Basic for Applications, a component of Microsoft Office, must also be installed; if you receive an error about the workbook having lost its VBA project, make sure that Visual Basic for Applications is installed by using the Programs and Features dialog (Add/Remove Programs in older versions of Windows) to modify your Microsoft Office installation. Visual Basic for Applications can be found under the Office Shared Features heading in the Office installer.
The Excel add-in features:
• Highlight and Plot - It's easy to plot just a portion of your data. Click in the upper left cell of the region or highlight the entire region, and then click on the Tecplot button in the Add-Ins ribbon or toolbar or on the Tecplot option in Excel's Tools menu.
• Multiple Zones - The Excel Add-In makes loading multiple zones much easier. Highlight the entire region and then click on the Tecplot button in the Add-Ins ribbon or toolbar or on the Tecplot option in Excel's Tools menu. If your zones are separated by blank rows or columns, the add-in will automatically detect them and load them into Tecplot 360 EX.
• Formulas - The highlighted region of the spreadsheet can contain formulas, or can be created entirely with formulas.
The first time you use the Excel Add-In, you will be prompted to choose the Tecplot 360 EX executable to be launched from Excel. This will be the tec360.exe file in the bin folder of your Tecplot 360 EX installation. Your choice will be remembered and you will not be asked again unless the Excel Add-In cannot find the previously-chosen executable. A button in the Tecplot section of the Excel ribbon (or the Tools menu), Find Tecplot, will allow you to choose a different Tecplot 360 EX executable if you have upgraded or wish to use the Excel Add-In with more than one installed version of Tecplot 360 EX.
A Read Me file, located in the Util/Excel directory, further describes installation and use of this add-in.
As an example, let's say you have 3D data obtained by drilling a number of wells and measuring contaminant concentrations of various chemicals at different depths. Your data is in an Excel spreadsheet, and you want to load the data into Tecplot 360 EX to get a visual representation of the contamination. The data has nine variables and twenty-seven zones. A small part is shown in Figure B-4.
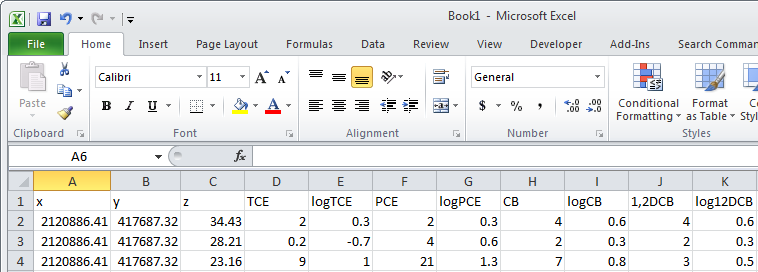
Figure B-4. The beginning well data displayed in Excel.
|
|
 Make sure you have a blank row separating the zones in your Excel spreadsheet.
Perform the following steps to import your data and visualize the contaminant plumes:
1.Starting with the top left-hand cell, highlight all twenty-seven zones and nine variables.
2.Click on Tecplot in Excel's Add-Ins ribbon. The menu option launches Tecplot 360 EX with the selected data loaded.
3.Switch to 3D Cartesian plot mode to see the location and measurement depths of the well samples. The resulting plot is shown in Figure B-5.
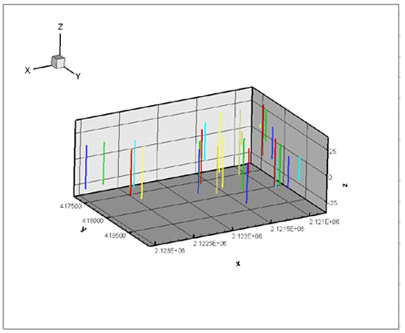
Figure B-5. The Excel well data plotted in Tecplot 360 EX.
Your wells have different depths, so the number of measurements are not the same for each well (there are only three measurements at well five).